node_red usage example UDP
Example of usage of UDP
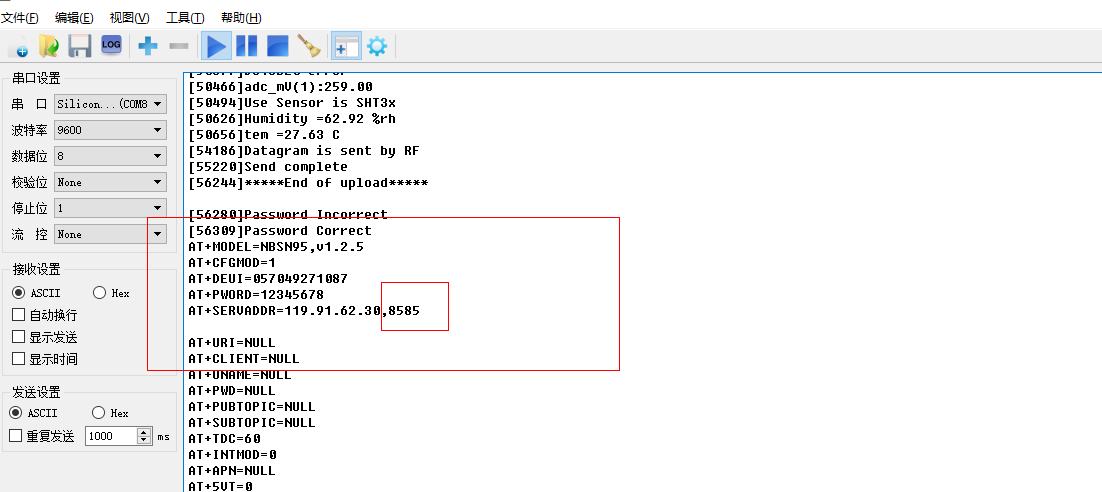
Take NBSN95 mod1 as an example
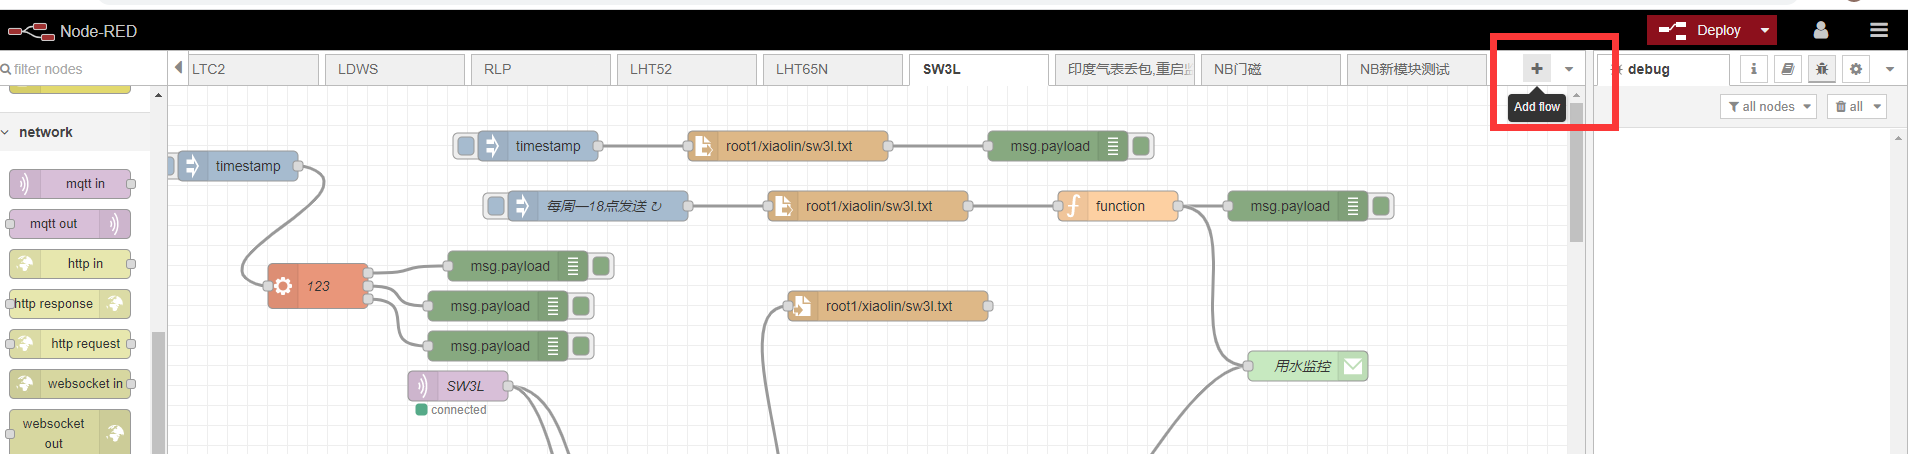
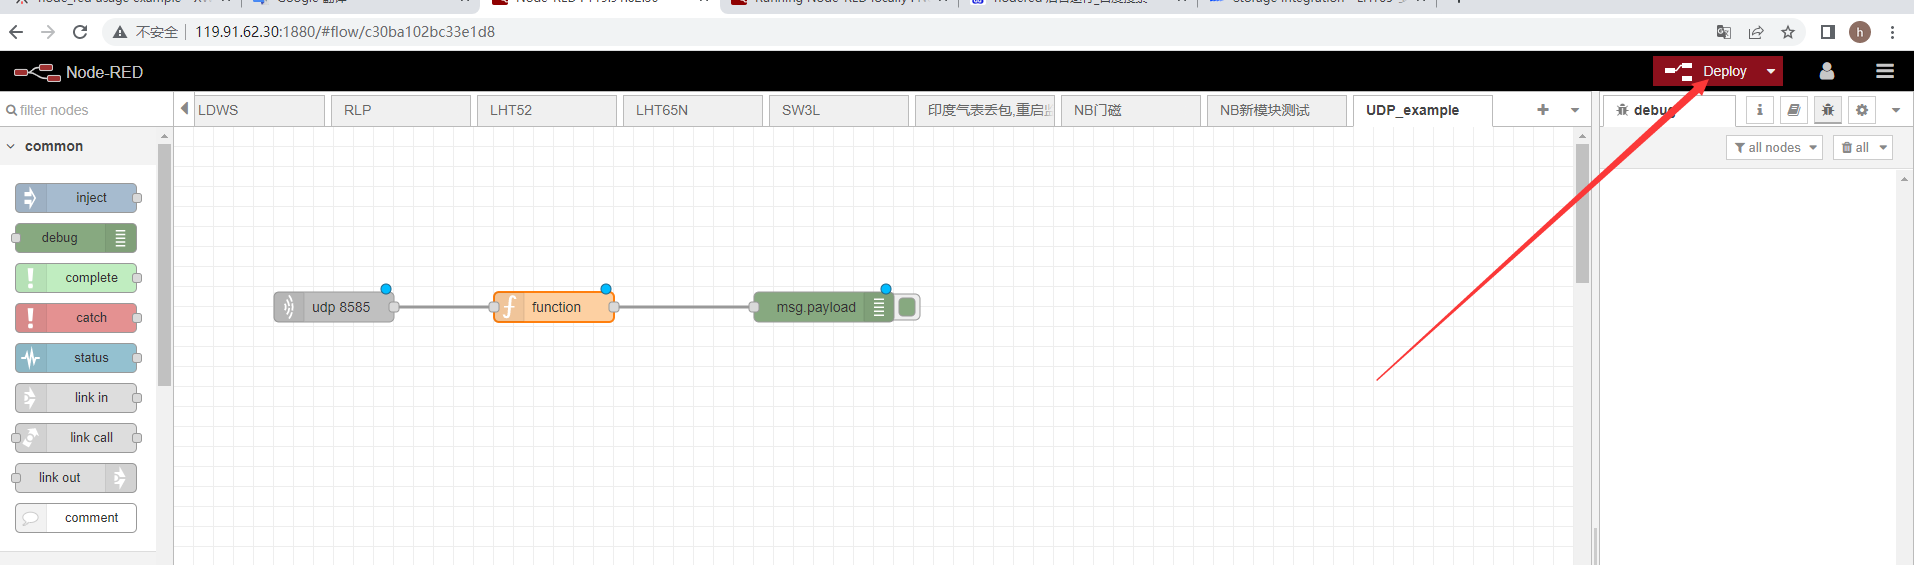
After logging into the interface click '+' to create a flow
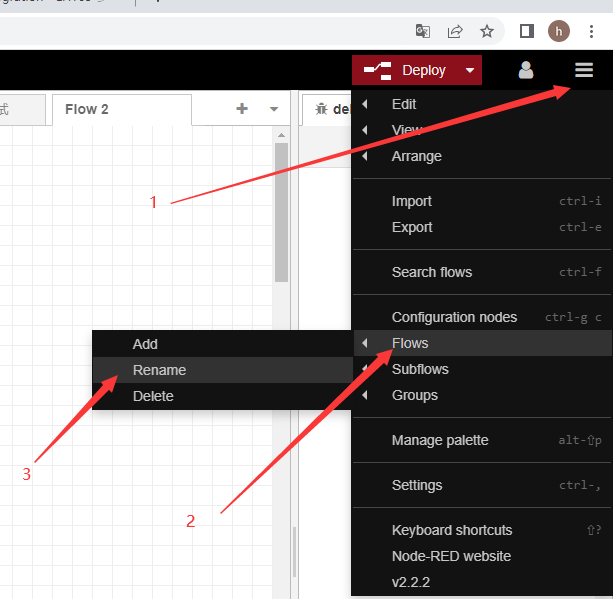
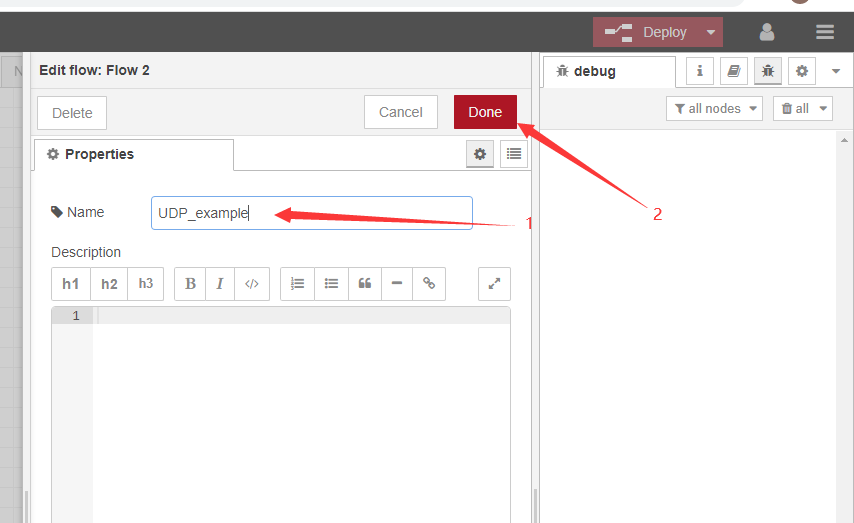
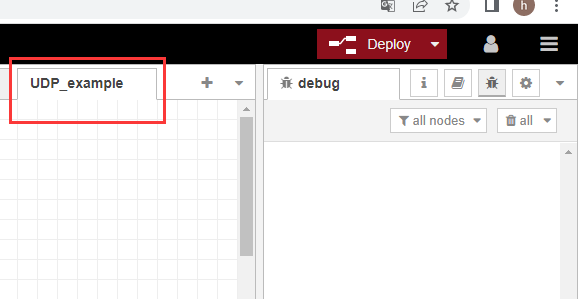
Rename the stream
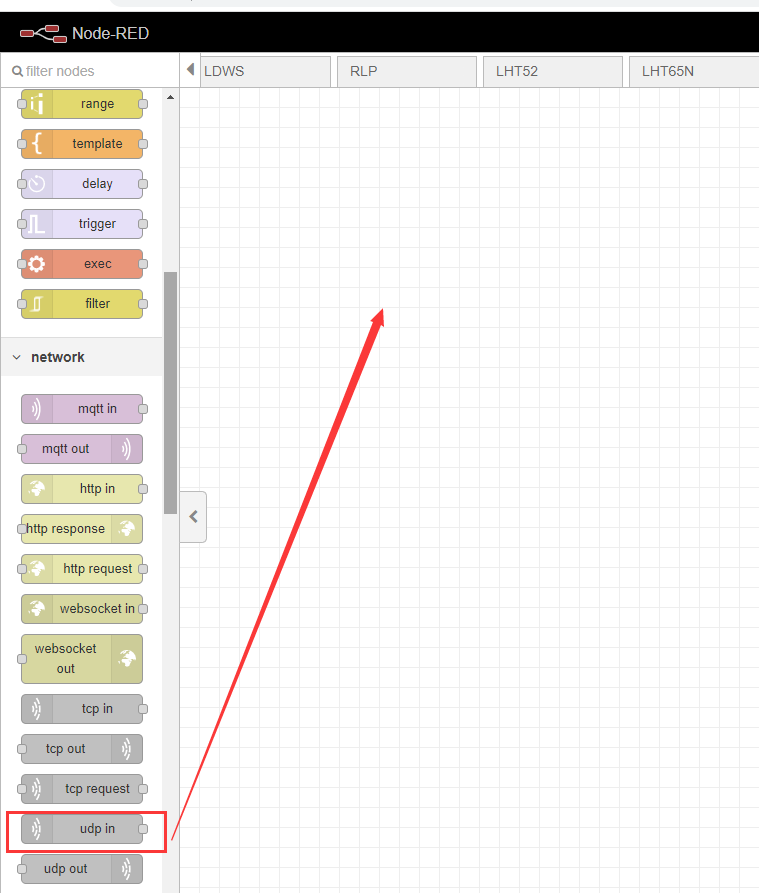
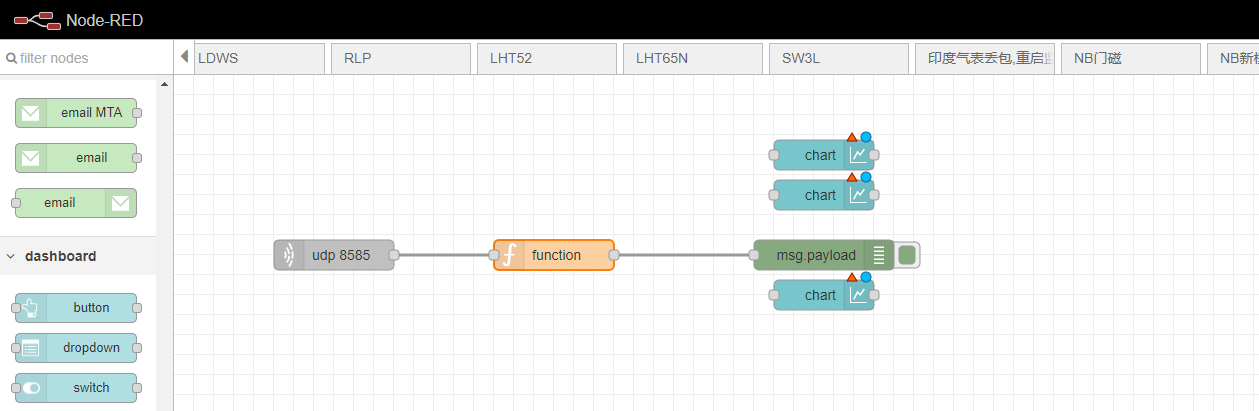
Drag UDP into the editing area
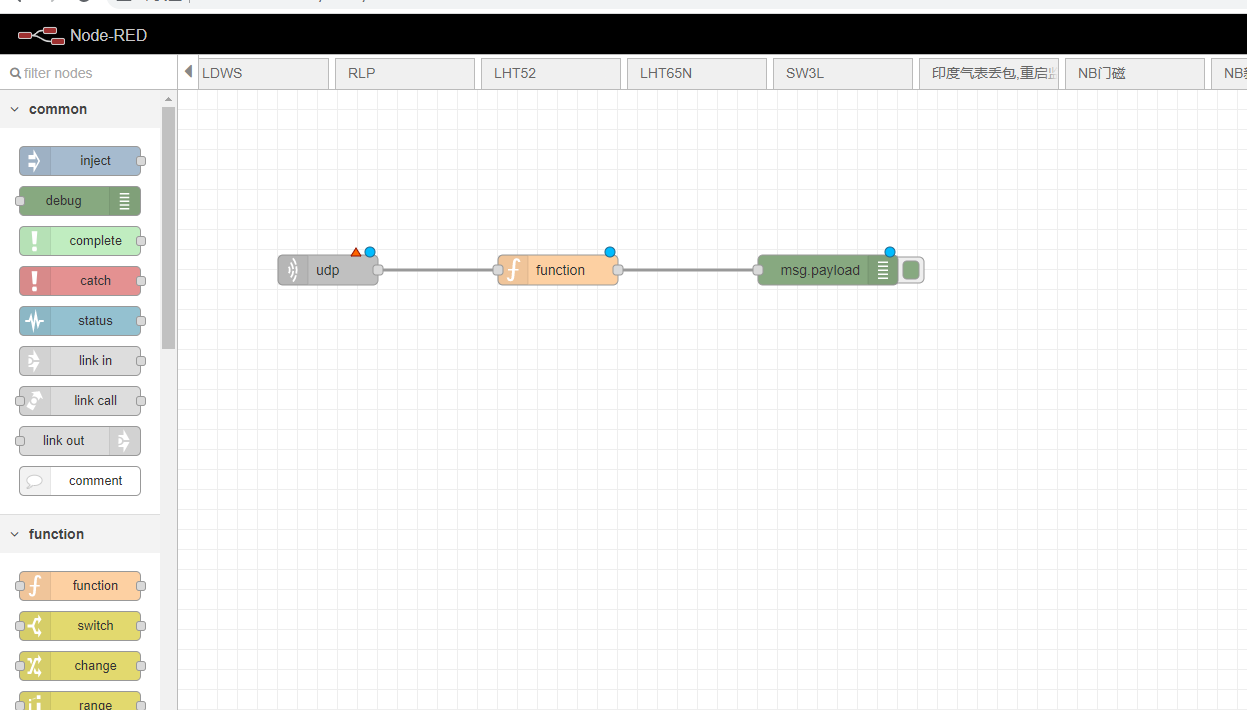
The same method as above, drag and drop functions and debug into the editing area
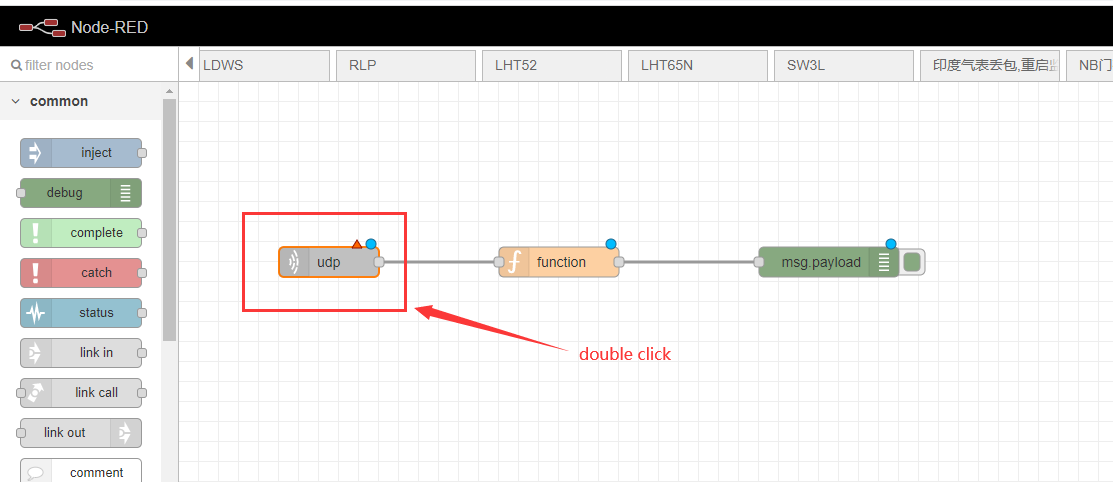
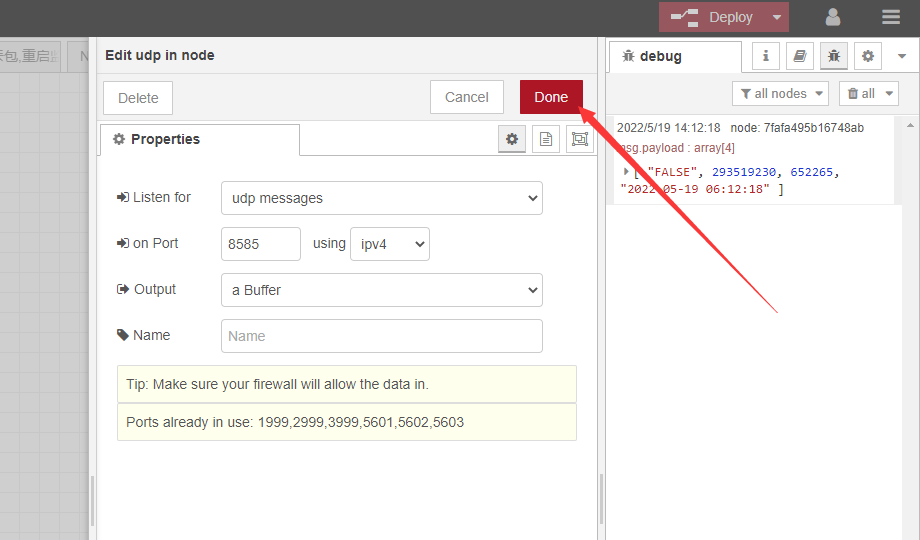
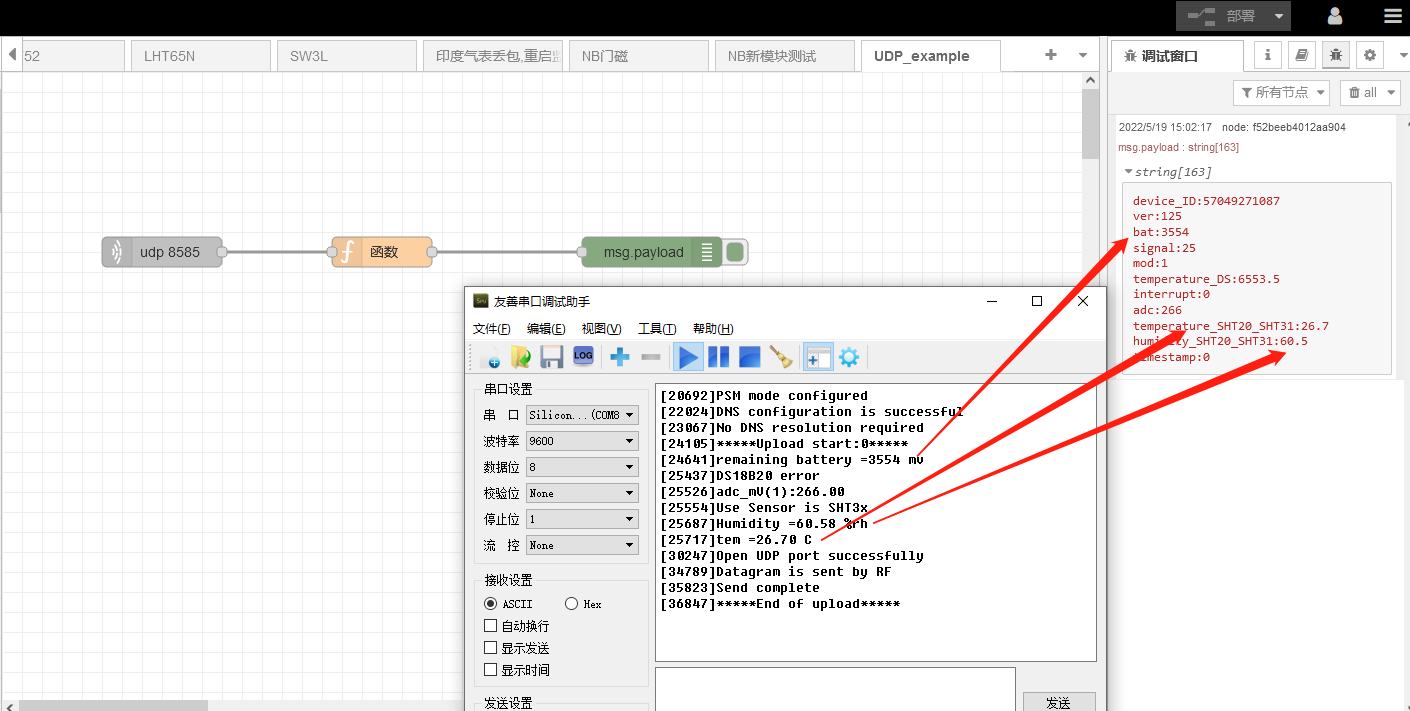
configure UDP in
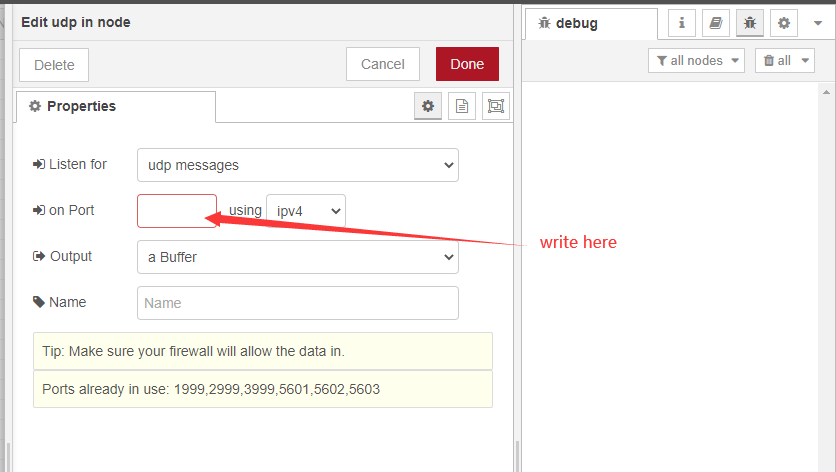
Write to the UDP port that the device node sends to the server
Example My UDP device node sends to server port 8585
just write 8585
Note that the port that is already in use cannot be used. If the receiving fails, you need to check whether the port of the server is occupied. The sending port of the device node should not use the default port used by the server, such as a common port such as 8080.
In order to avoid data confusion, different types of nodes do not use the same UDP port, because different nodes have different data formats and different functions.
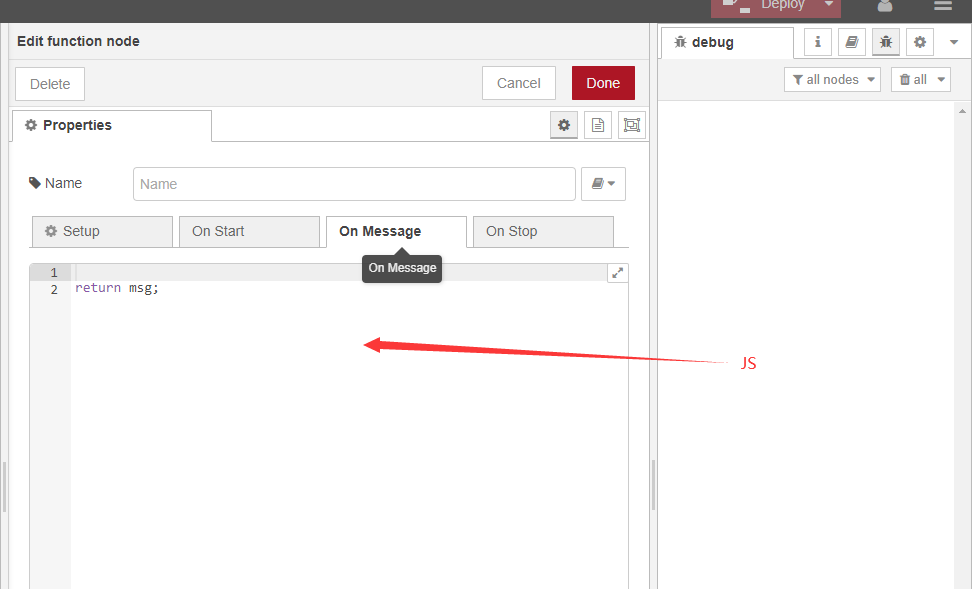
About function
If you are familiar with JS code, you can write it yourself
If you are not familiar, we have the JS code for each type of node, you just need to copy and paste it into it
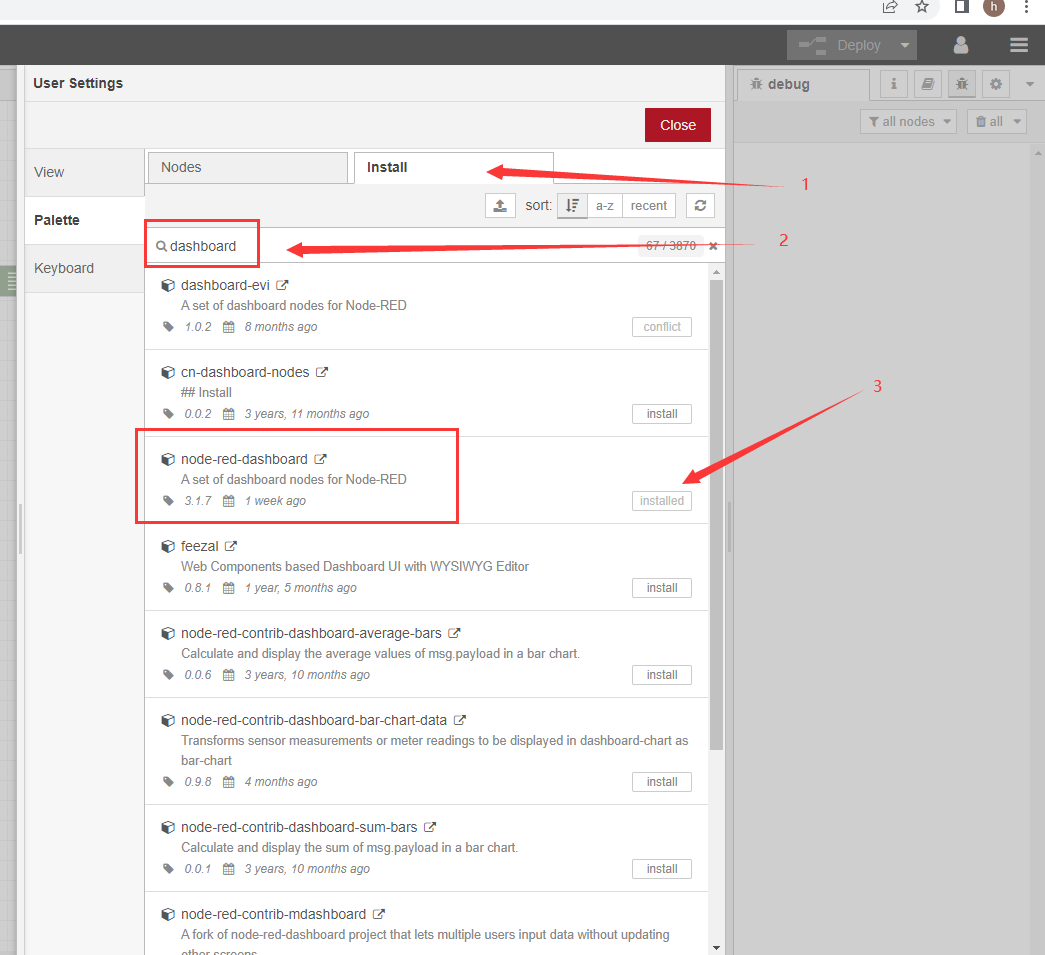
If you need data visualization, please refer to the following
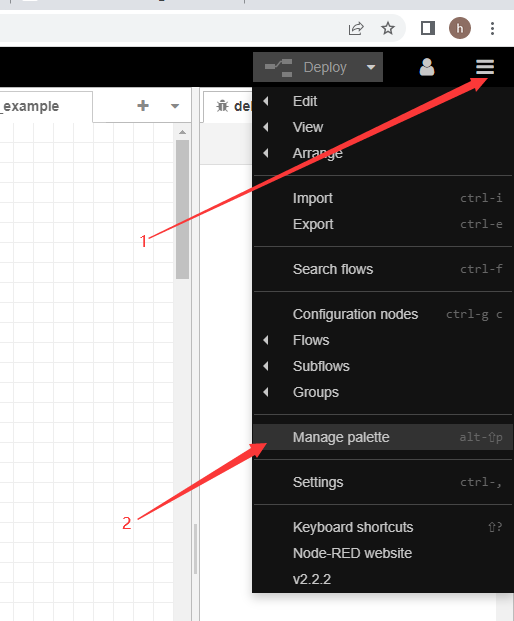
1. Click Install
2. Search the dashboard
3. Click Install
After the installation is successful, nodered will show the following node icon
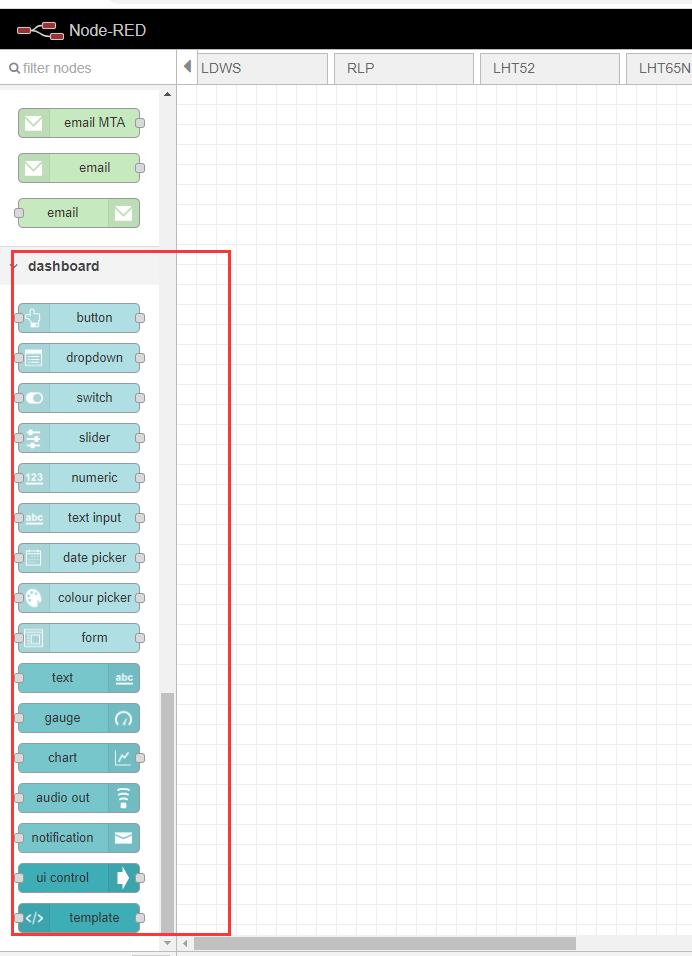
Below I use the line chart as an example
Drag the line chart to the editing area
Just drag and drop as many as you need, or you can copy
The demo uses 3 kinds. Voltage, temperature, humidity
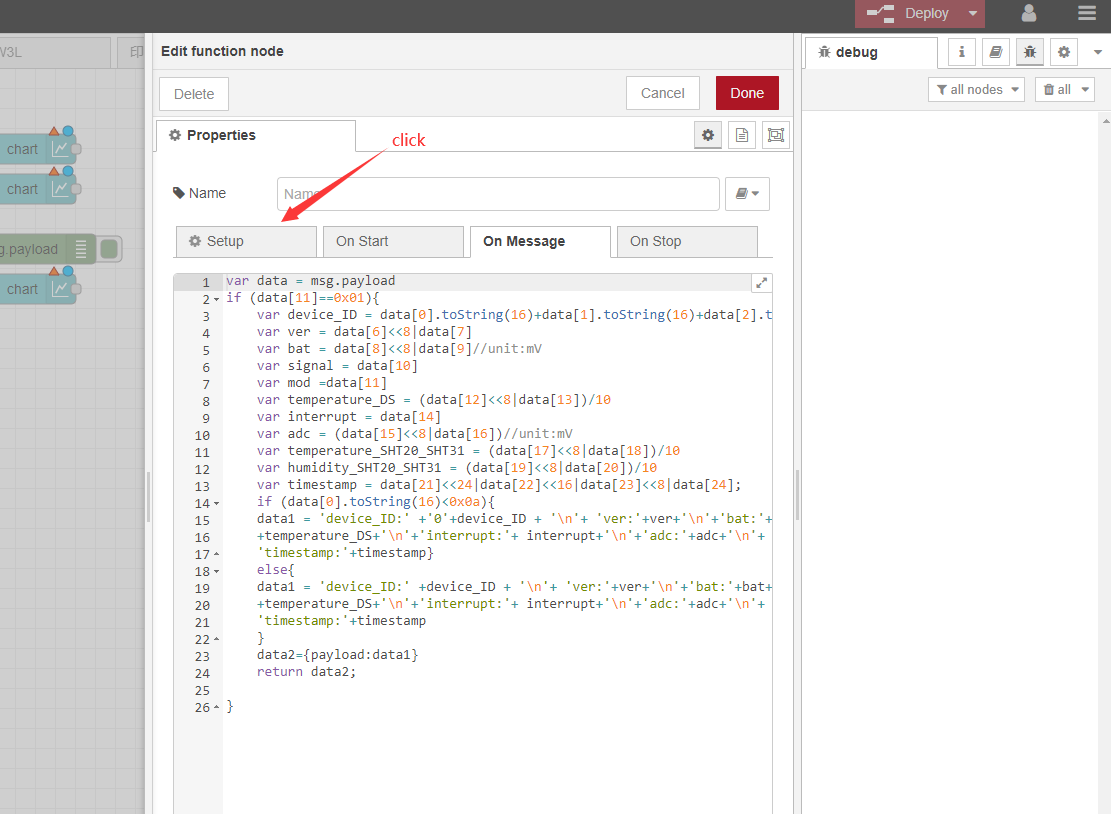
Double-click the function to set it
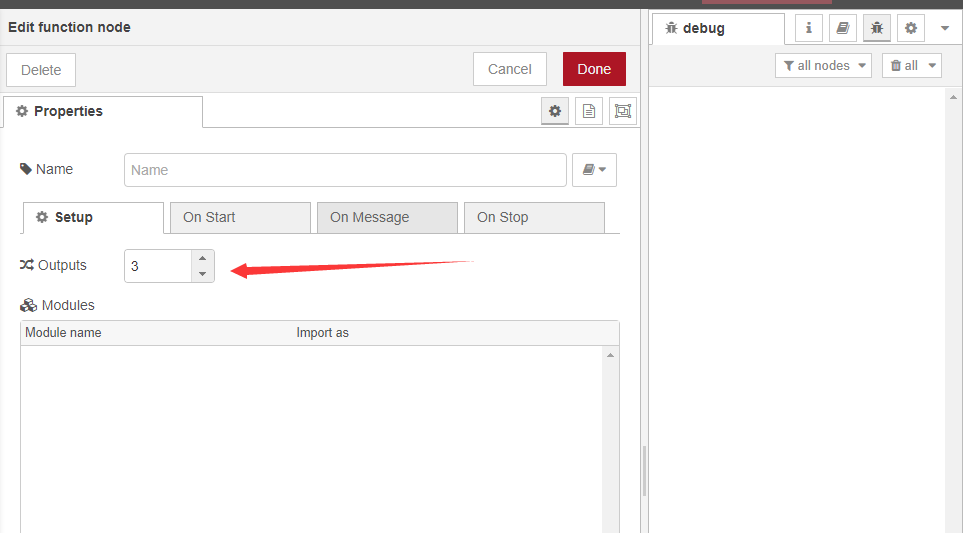
Adjusted to 3, because we need to display 3 charts
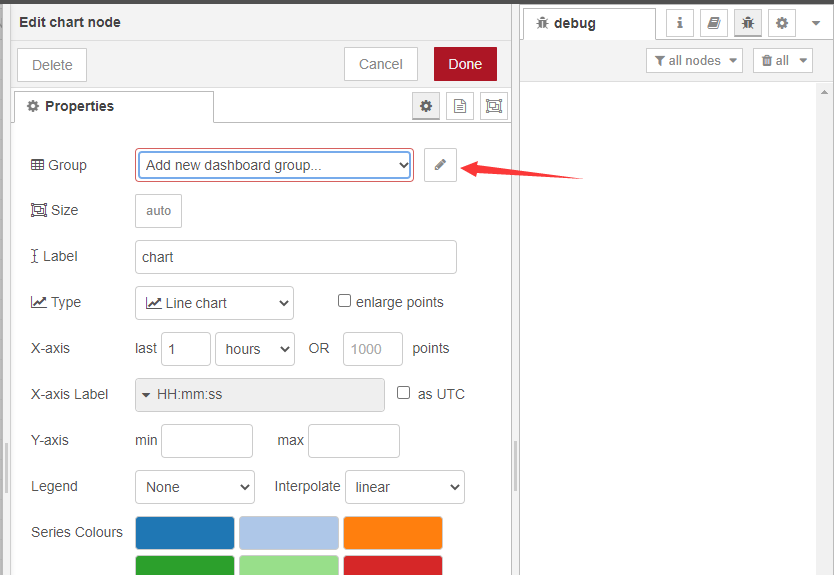
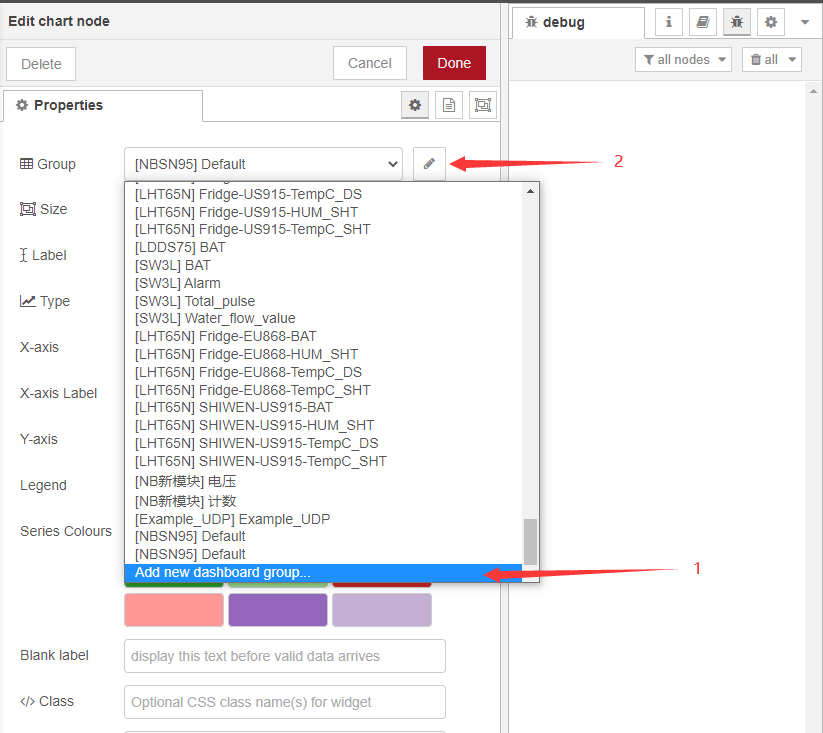
Below are the chart settings
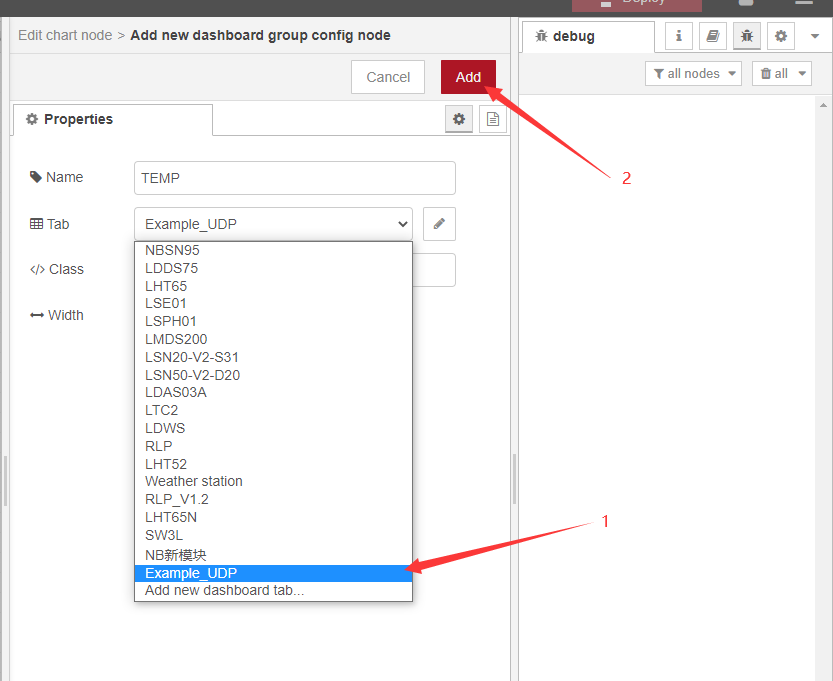
Double-click while setting up the node as above
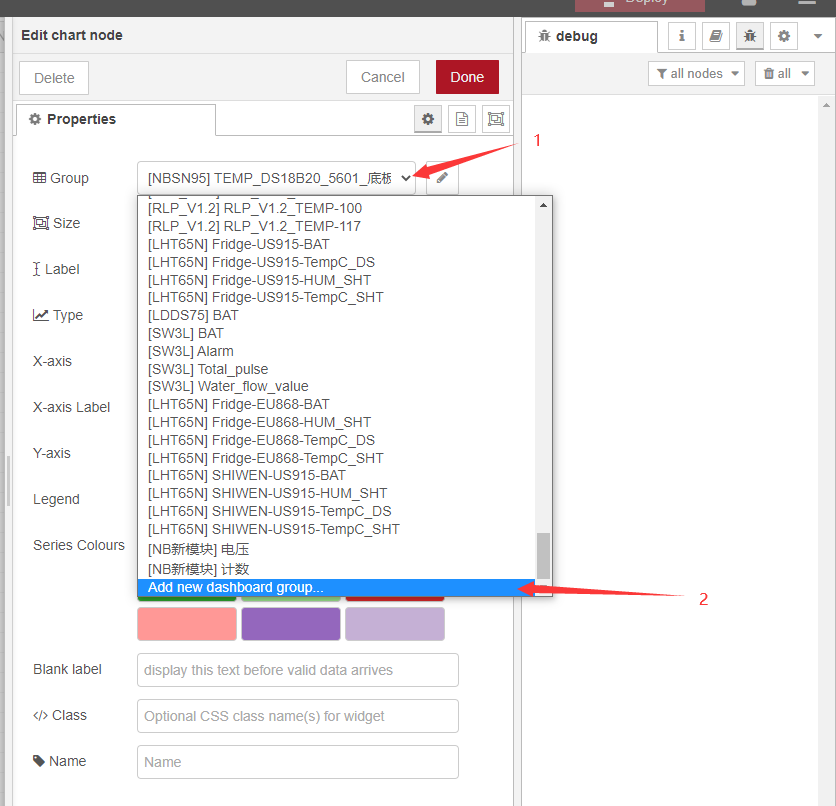
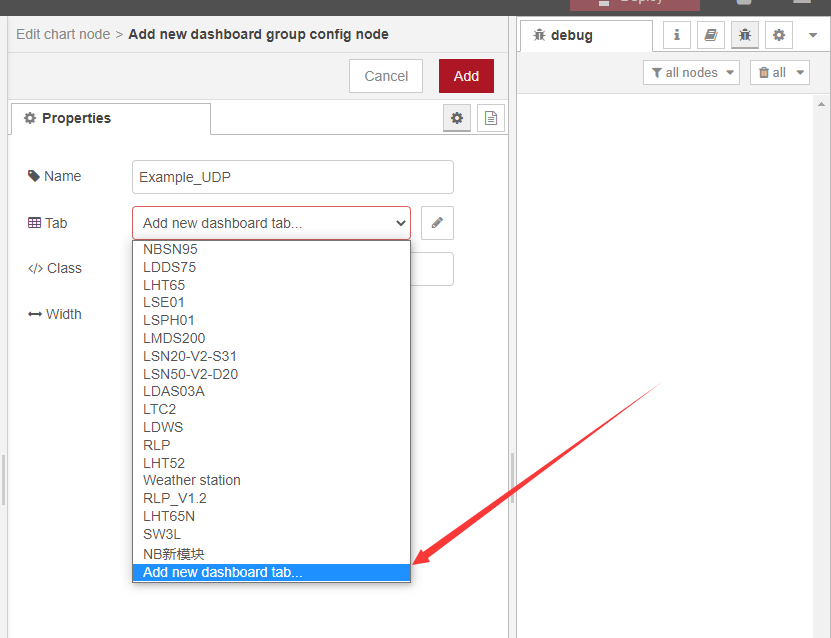
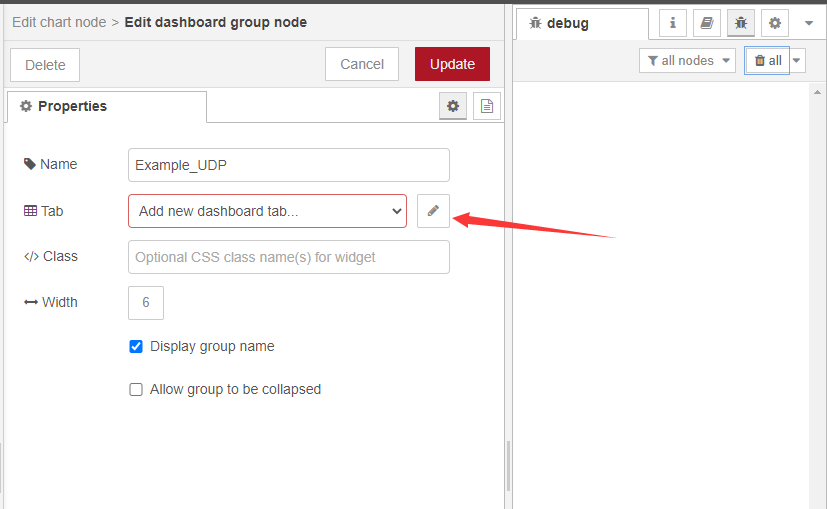
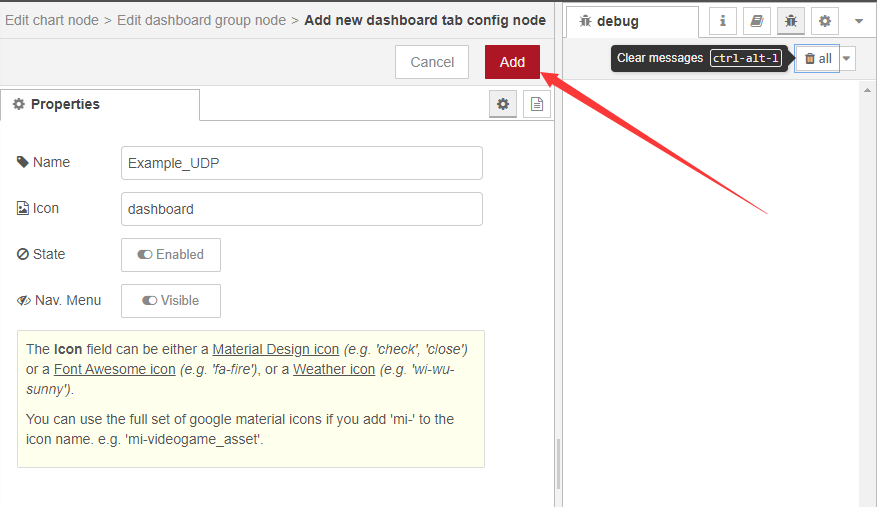
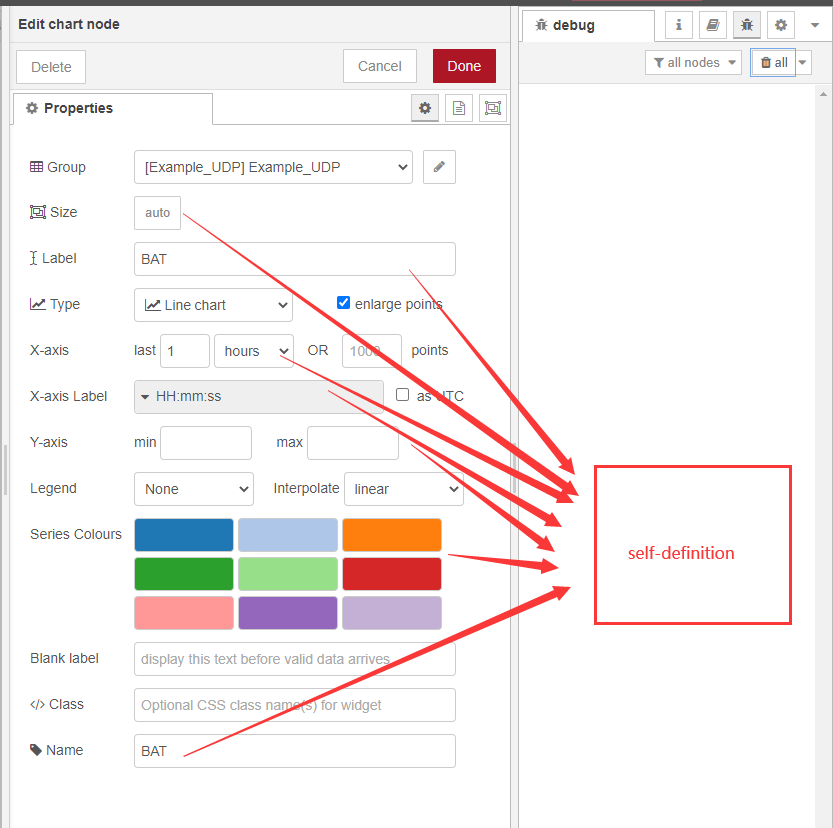
After the display interface is defined for the first time, subsequent charts can directly select the display interface
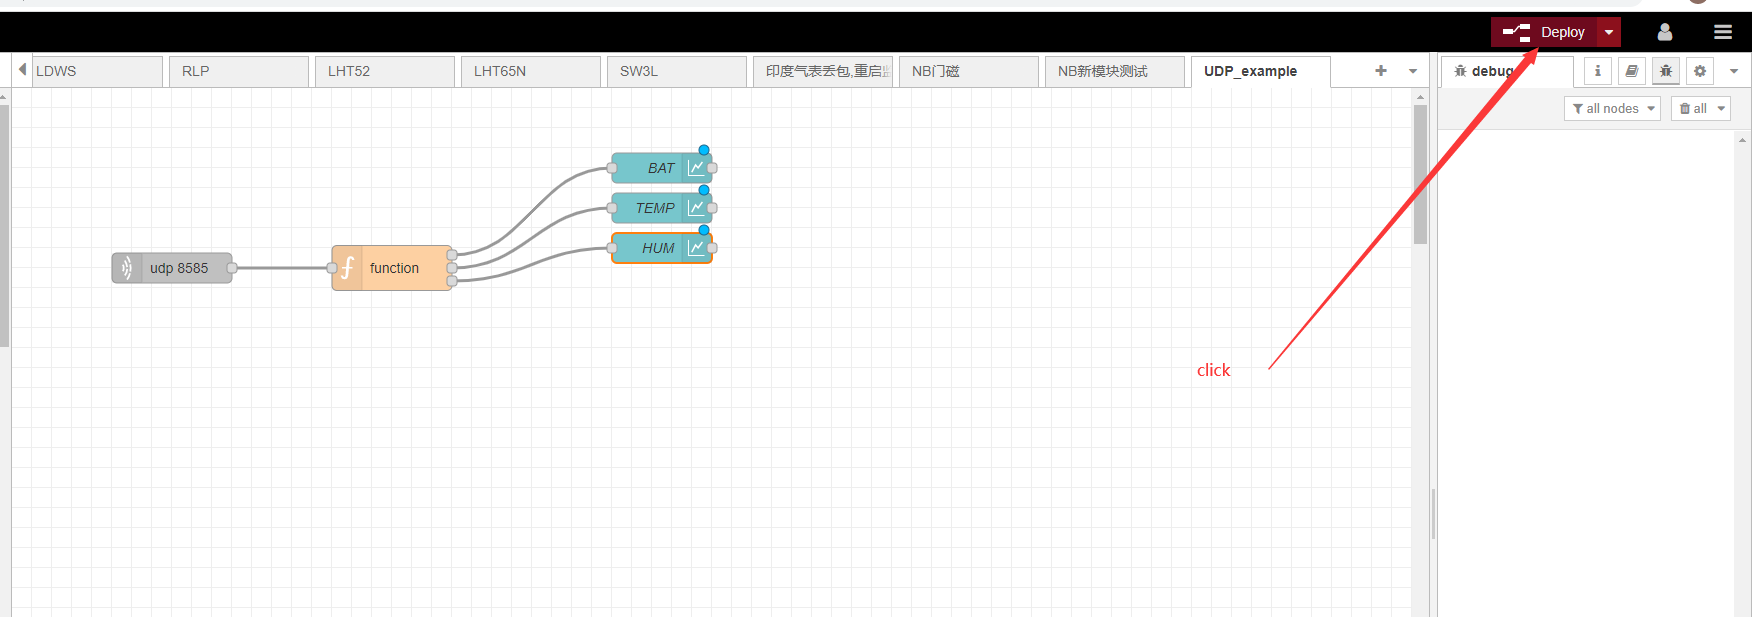
Connect graph nodes to functions with lines
Click to deploy
Enter the server public IP + port 1880/ui
example:http://xxx.xx.xx.xx:1880/ui
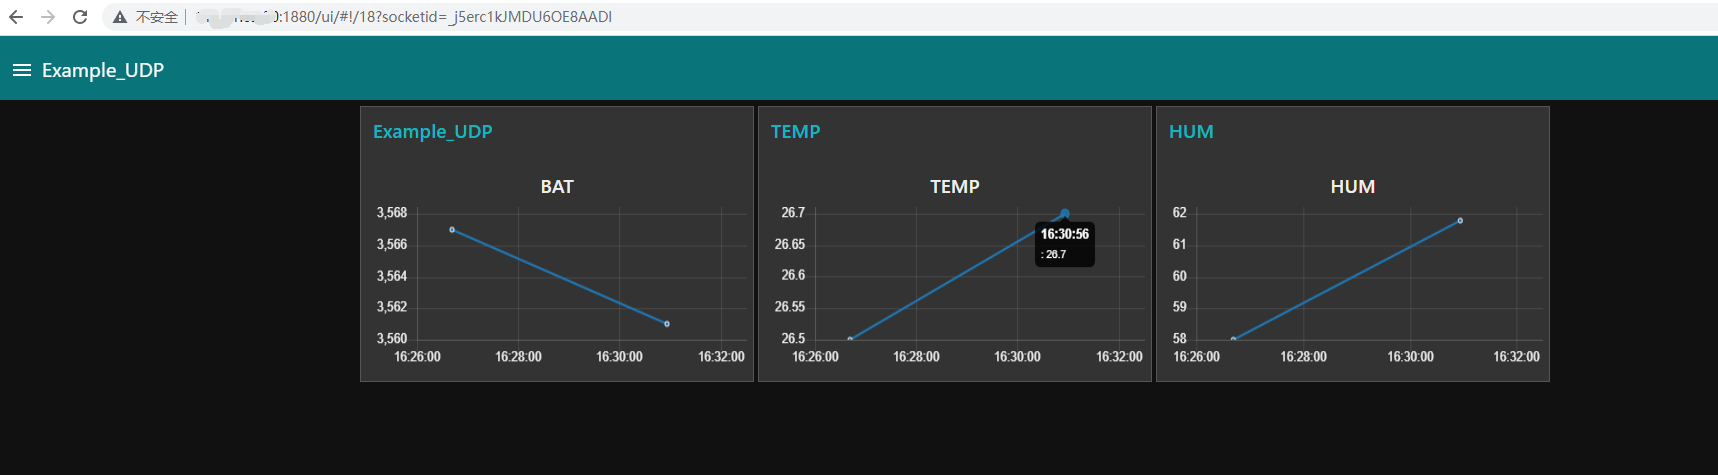
At this point, the basic demonstration of nodered is completed. If you need to beautify the chart and various visualizations, you can go to the official documentation of nodered for further understanding.