Browse the sections below to get started, or use the search to find specific documentation.
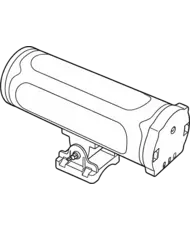
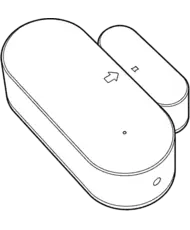
LoRaWAN End Nodes
User manuals and quick start guides for all Dragino LoRaWAN sensor nodes, trackers, actuators and controllers.
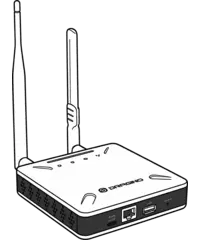
LoRaWAN Gateways
Setup and configuration guides for indoor and outdoor LoRaWAN gateways, including network server integration.
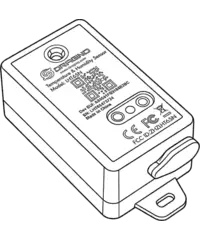
NB-IoT / LTE Devices
Configuration guides for NB-IoT and LTE cellular devices, including APN settings and connectivity.
Non-Wireless Sensors
Wired Modbus sensors and RS485 converters for industrial and environmental monitoring.
Configuration Guides
Step-by-step instructions for firmware updates, MQTT, HTTP configuration and device provisioning.
Knowledge Base
In-depth technical articles covering LoRaWAN protocol, antenna selection, power management and best practices.
IoT LoRaWAN Server
Integration guides for TTN, ChirpStack, AWS IoT Core, Helium and other network platforms.
FAQs & Troubleshooting
Common questions answered and troubleshooting guides to help you resolve issues quickly.