Adding the Dragino DDS20-LB to the Kilo IoT Platform
Introduction
The Dragino DDS20-LB is a LoRaWAN non-contact liquid-level sensor — it mounts on the outside bottom of a tank and beams ultrasound up through the container wall to read the fill level, without ever touching the liquid or needing a hole in the tank. This guide brings one onto the Kilo IoT Platform, from standing up a LoRaWAN server to a live, color-coded tank gauge on a dashboard.
It takes a few minutes, and most of it is picking the DDS20-LB from a list — Kilo ships a device-profile template for it, so the LoRaWAN class, frequency band, and payload decoder are filled in for you.
Kilo is built around customization and scalability — you decide how your data is modeled, displayed, and acted on, and the same setup scales from a single sensor to an entire site. If you need a high degree of flexibility and customization, the Kilo IoT Platform is a strong choice.
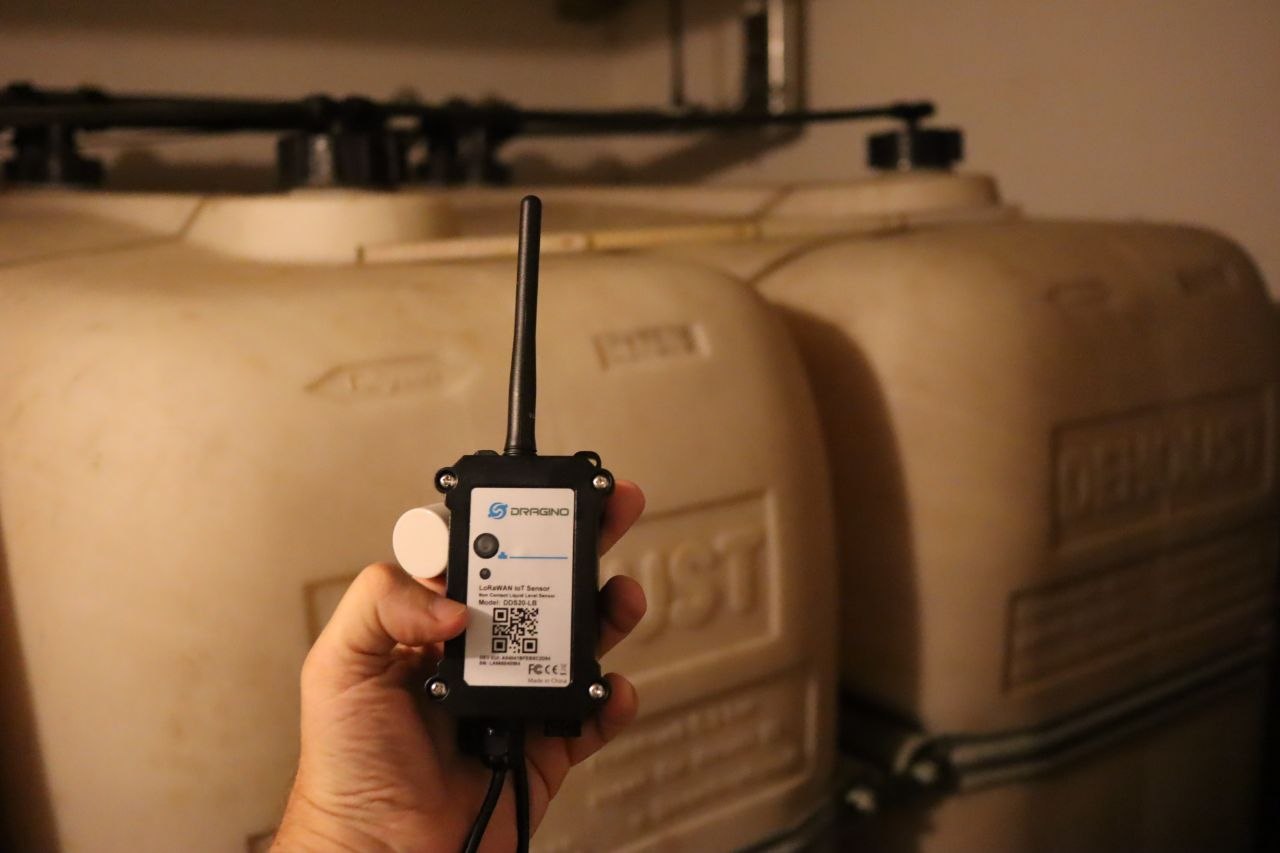 Dragino DDS20-LB — external bottom-mounted ultrasonic level sensor, by the tanks
What you'll need
- A Kilo IoT Platform account.
- The sensor's Device EUI and AppKey — printed on the DDS20-LB label and in its QR code.
- A LoRaWAN gateway on your region's band (EU868 in this guide) forwarding to the platform.
- The DDS20-LB and compatible gateways can be purchased at kiloelectronics.com.
Steps as follows:
Step 1 — Stand up a LoRaWAN server (add the LNS connector)
In the sidebar open Connectors, click Add connector, and choose LoRaWAN (LNS). That's the whole step — with that one choice Kilo rolls out a fully managed LoRaWAN Network Server for you. There's no separate LNS to install, configure, or maintain; the connector appears in the list and you're ready to add sensors and accept their join requests.
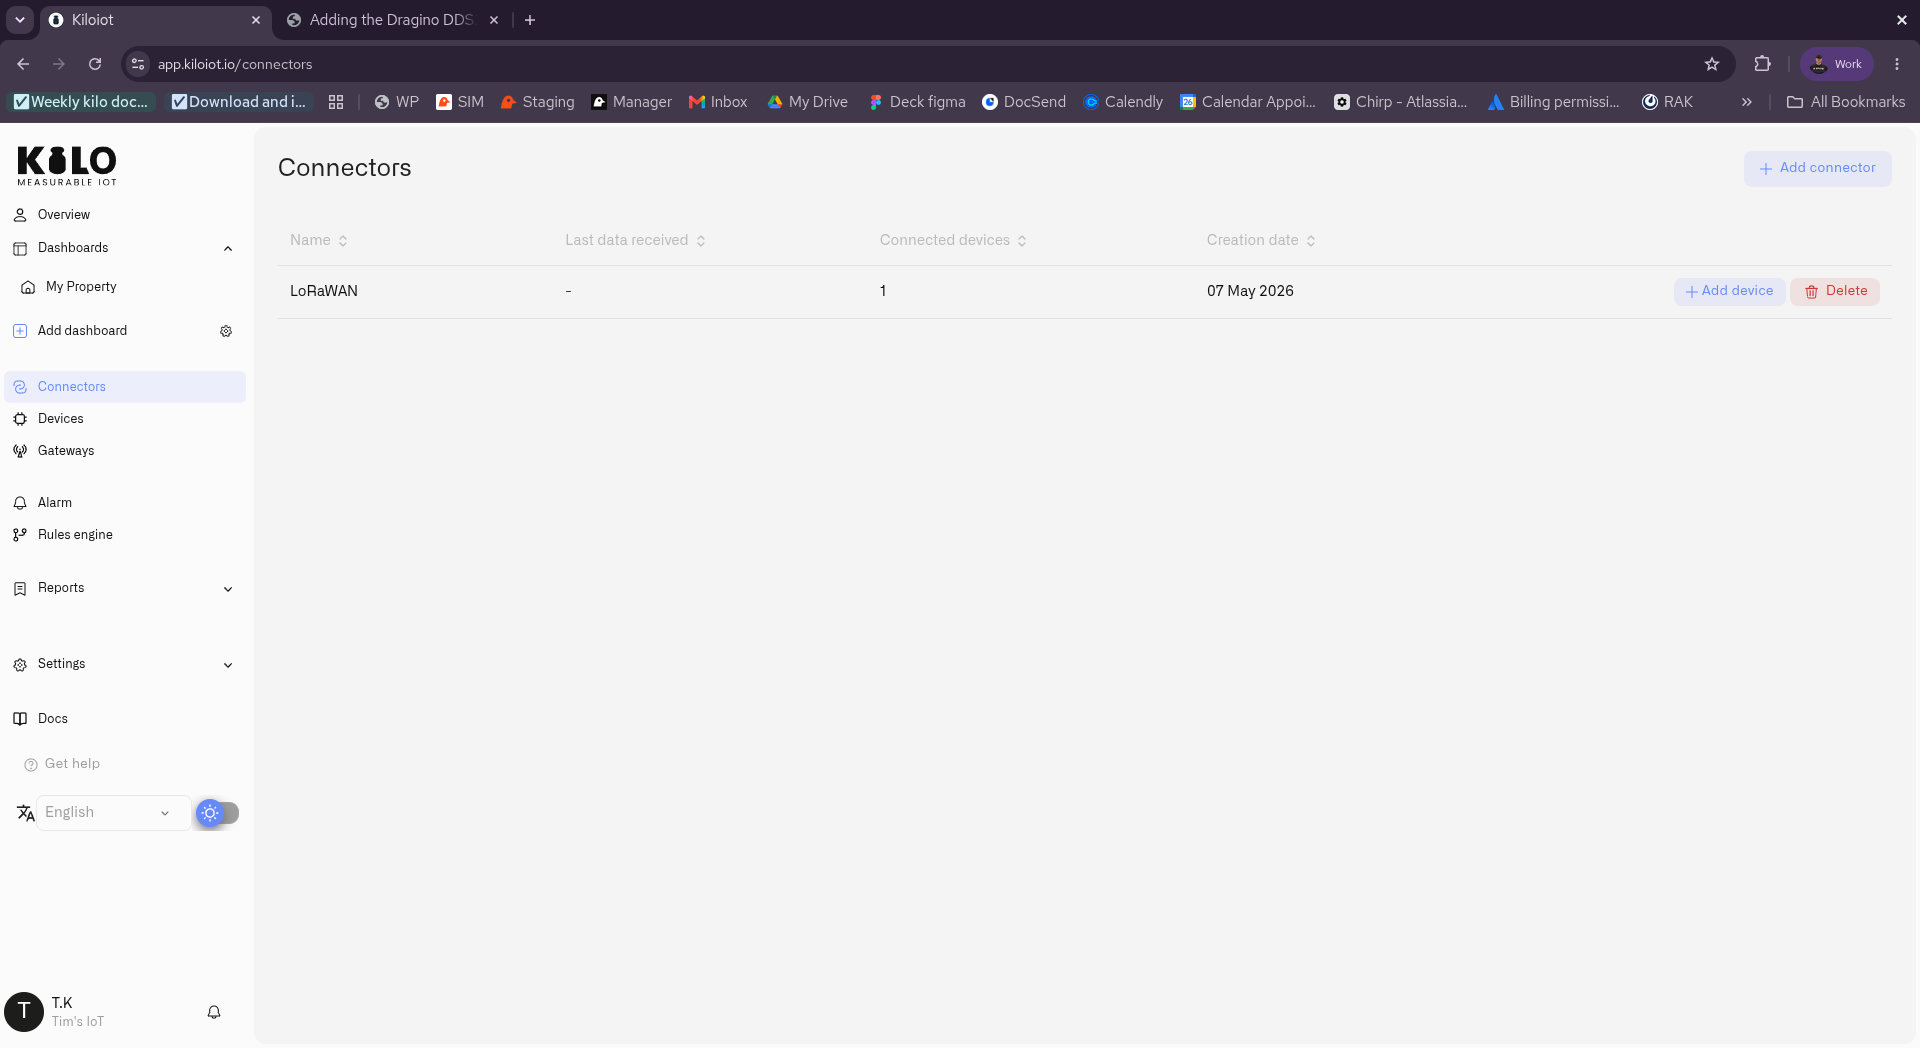 The Connectors page with a LoRaWAN (LNS) connector and the Add connector button
Step 2 — Add a device
Go to Devices in the sidebar, then click Add device (top right).
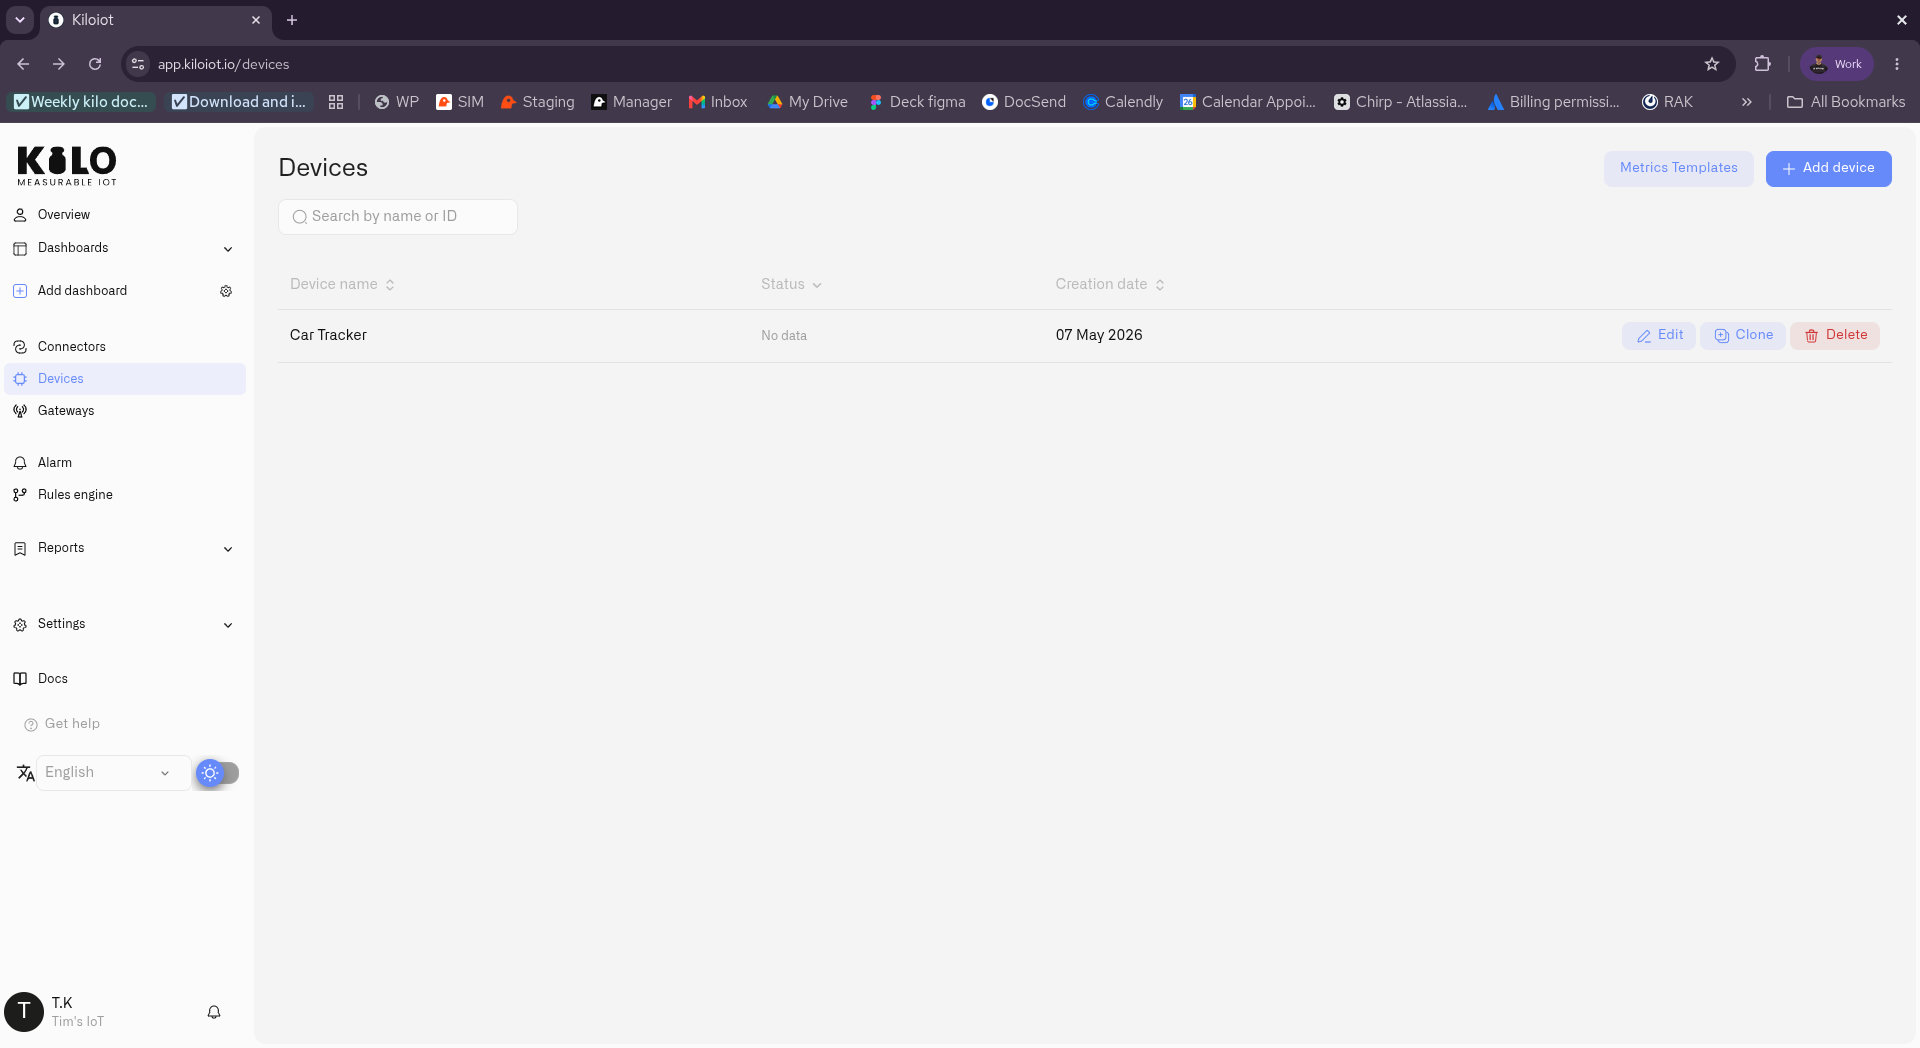 The Devices page with the Add device button
Step 3 — Name it and add a photo
Give the device a clear name — for example Tank Distance Sensor — and optionally upload a photo of the physical unit. Click Save. Kilo creates the device's Digital Twin and opens the rest of the configuration.
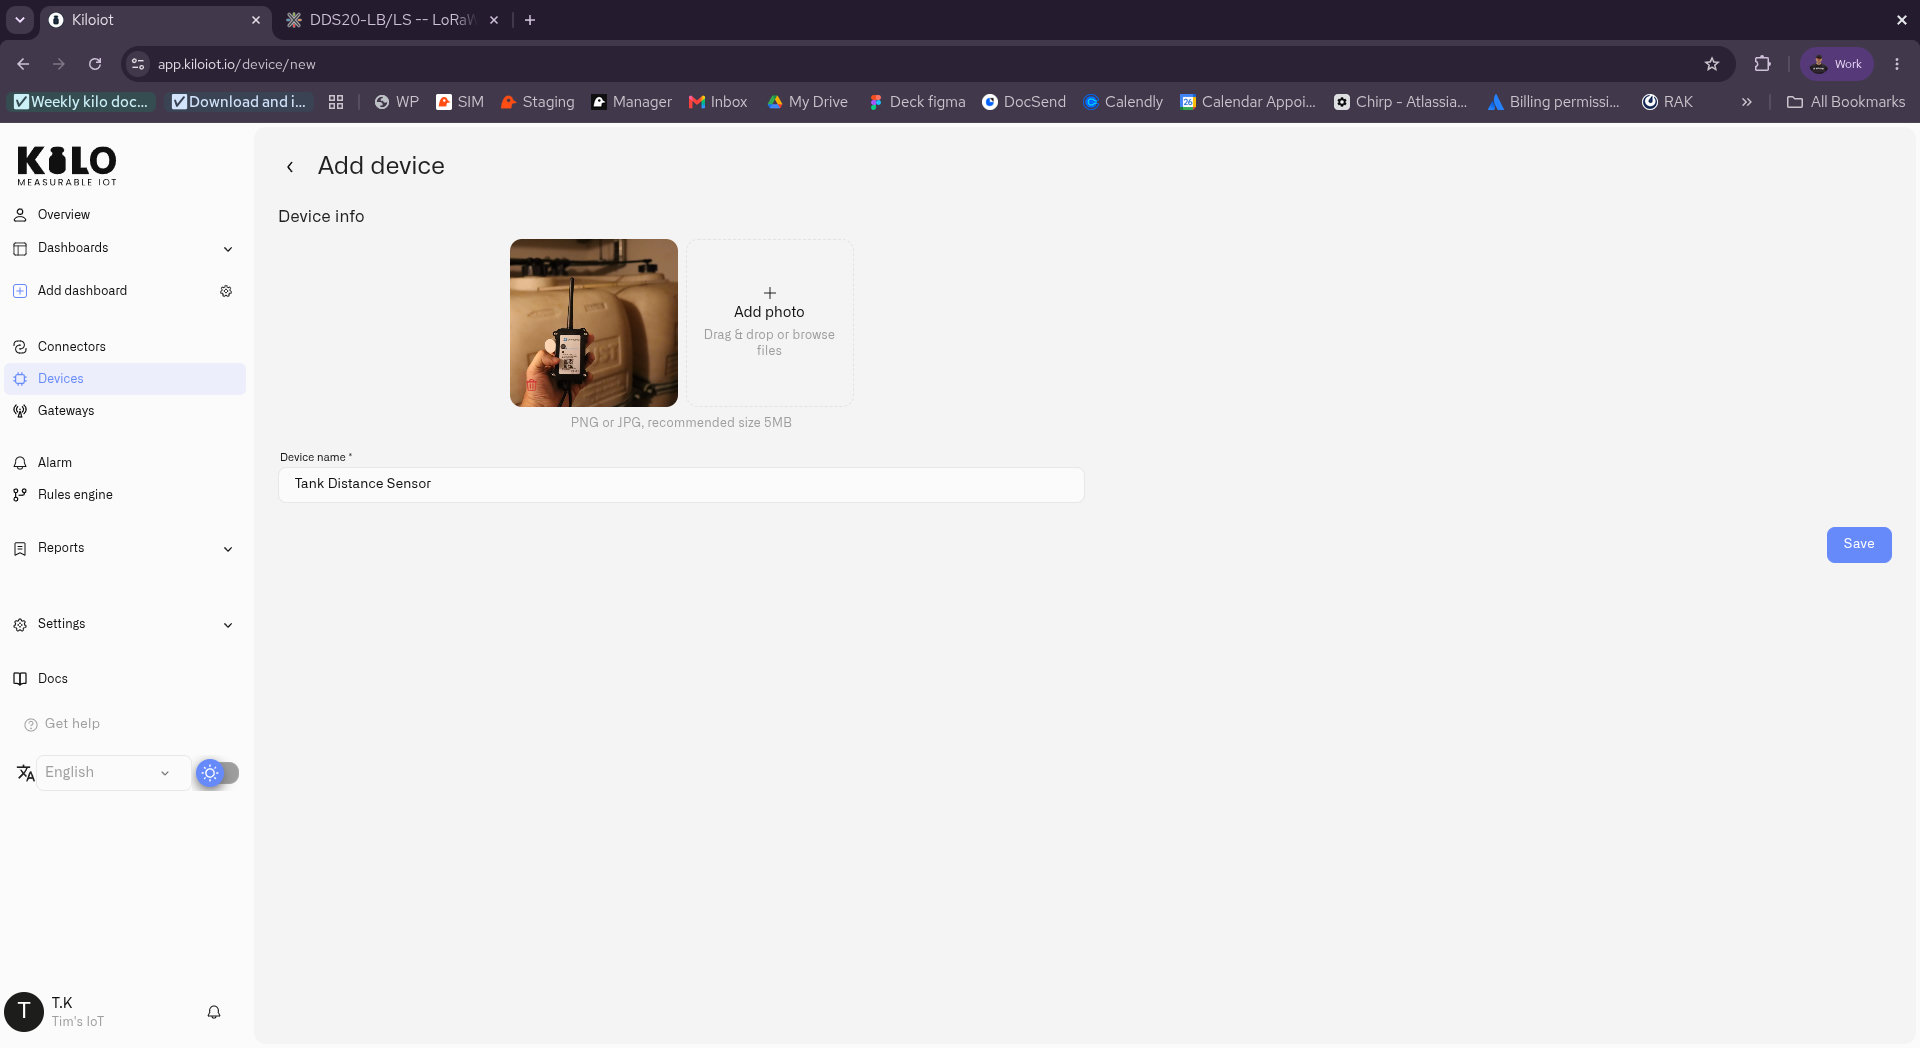 Device info — name and photo
Step 4 — Connect it and pick the DDS20-LB template
Open the Connection tab. Set Connector type to the LoRaWAN (LNS) connector you just created, tick Use device profile templates, and choose Brand: Dragino, Model: DDS20-LB, Profile: EU863-870. Kilo fills in the LoRaWAN class (Class A — low-power battery mode), the band, and the payload codec automatically.
Kilo ships a device codec library that covers most LoRaWAN devices, so for the majority of sensors the decoder is already there, ready to use — you just pick the device. If a codec for your device isn't in the library yet, you can write your own or upload one (the Code functions field in the next step).
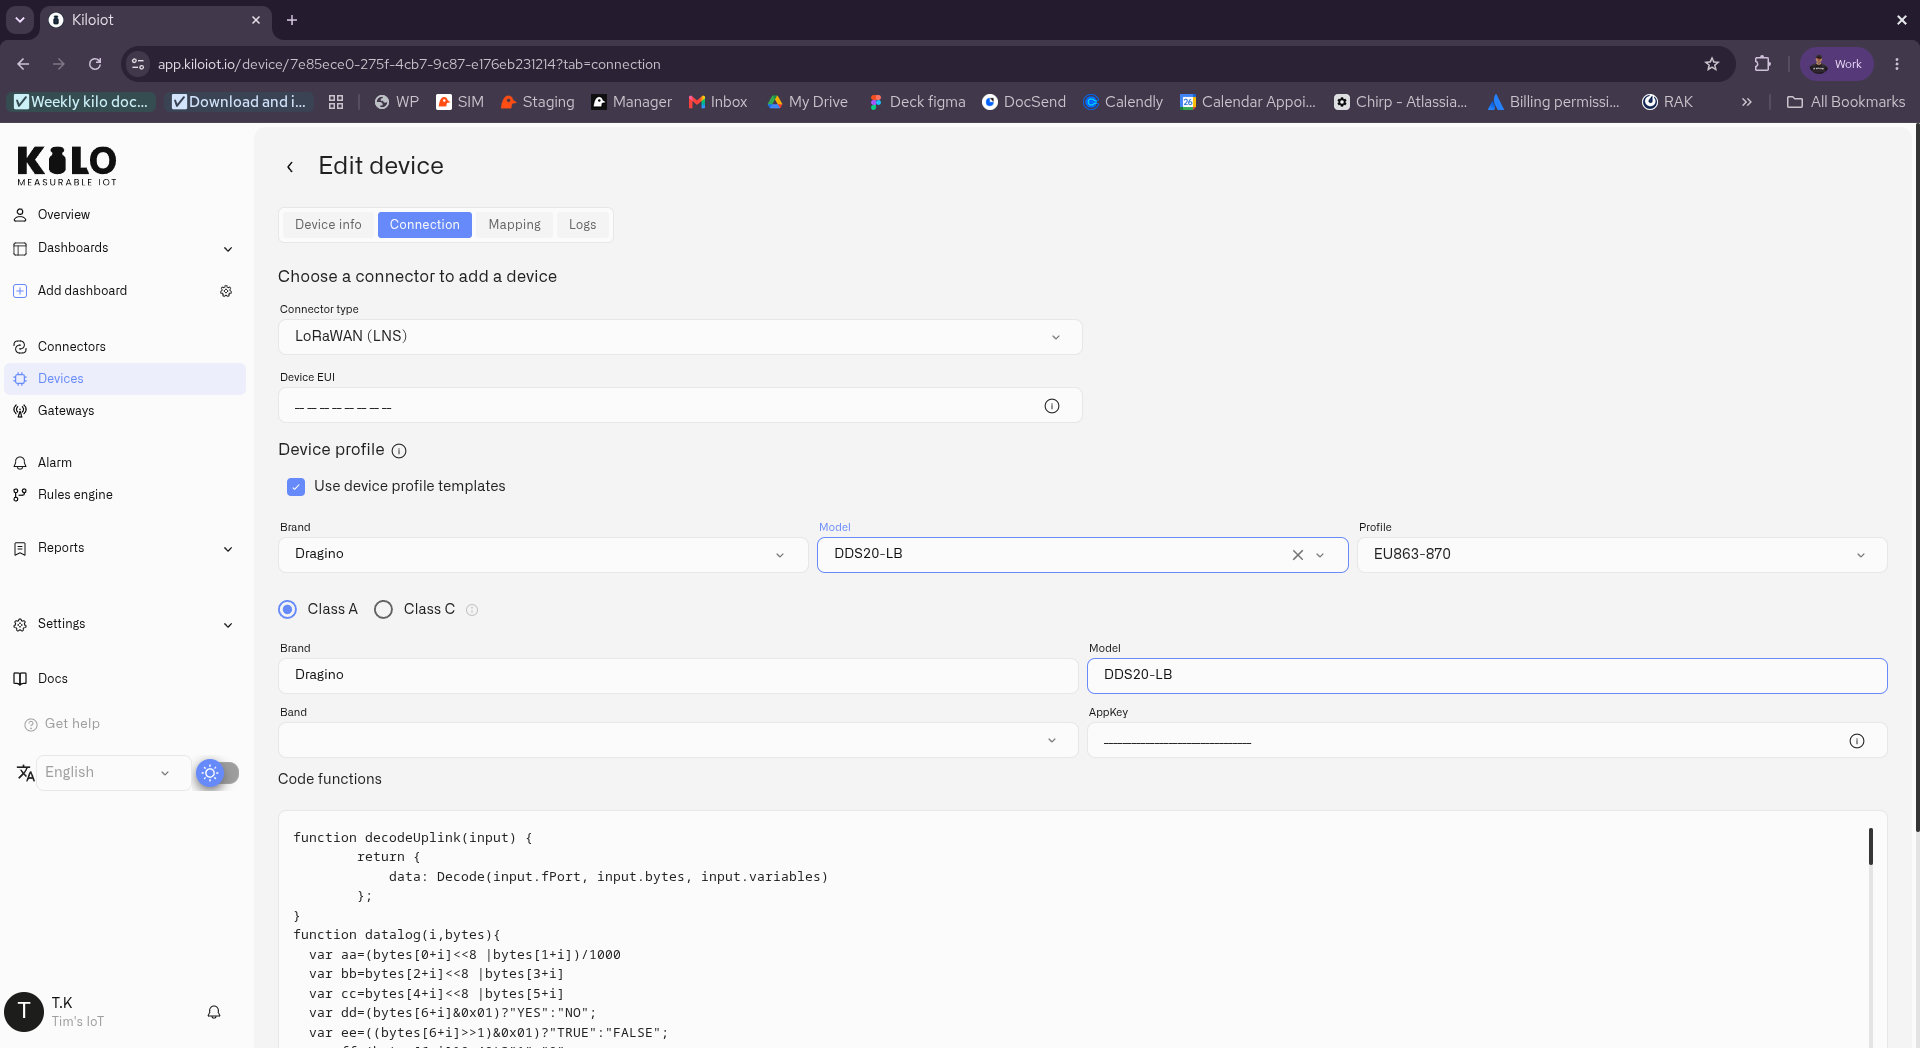 Connection tab with the Dragino DDS20-LB profile template selected
Step 5 — Enter the Device EUI and AppKey
Enter the Device EUI and AppKey from the sensor's label. With the template applied, the Code functions field already contains the DDS20-LB's decoder — the logic that turns the raw LoRaWAN bytes into named fields like Distance_cm and BatV. (Codecs are convenience helpers; if a field ever looks off for your firmware revision, you can edit this decoder directly here — or paste/upload your own.)
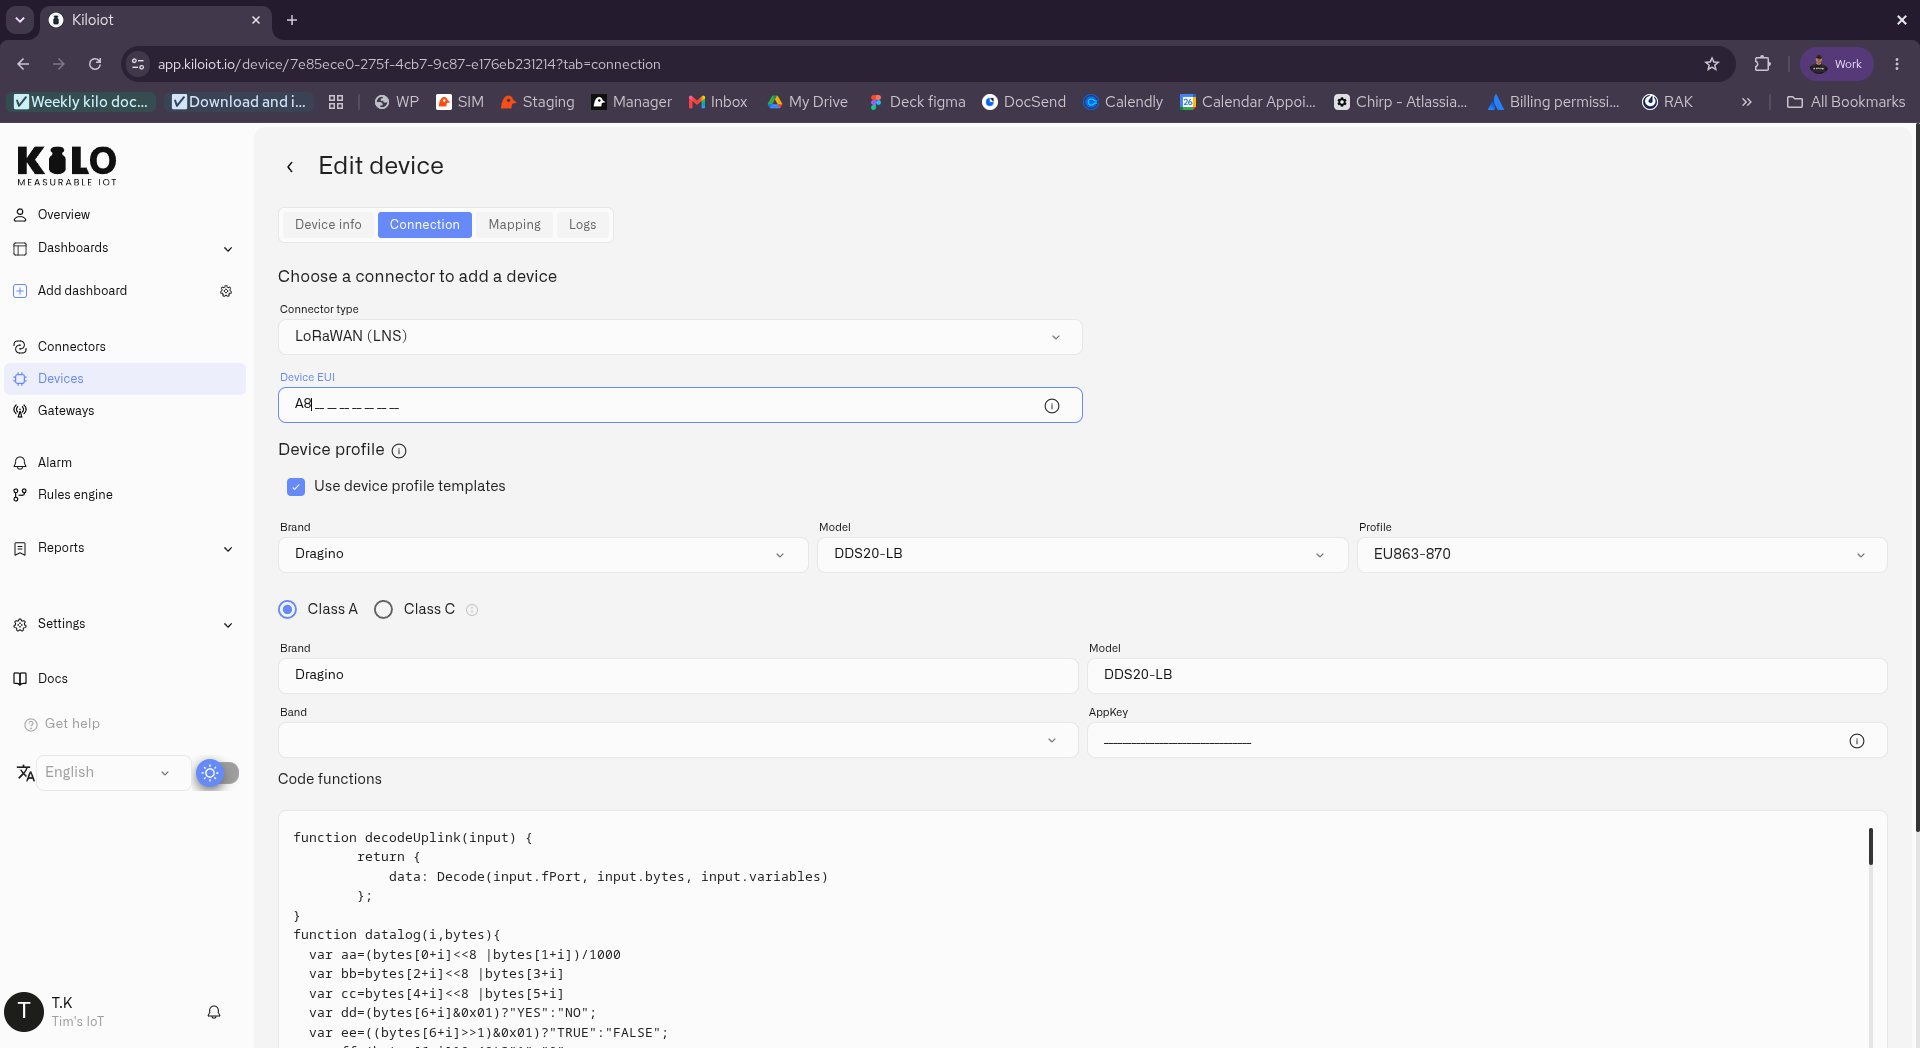 Device EUI, AppKey, and the auto-filled codec
Step 6 — Set the data-sending interval
Tell Kilo how often the device transmits. Every device reports on its own schedule — every few minutes, once a day, once a month — and that interval is set on the device itself, so the platform has no way to know it unless you tell it. This is exactly what lets Kilo tell the difference between a device that's simply quiet between scheduled reports and one that has actually gone offline. Match this value to the device, and a healthy low-power sensor is correctly shown as online — never falsely flagged offline between reports.
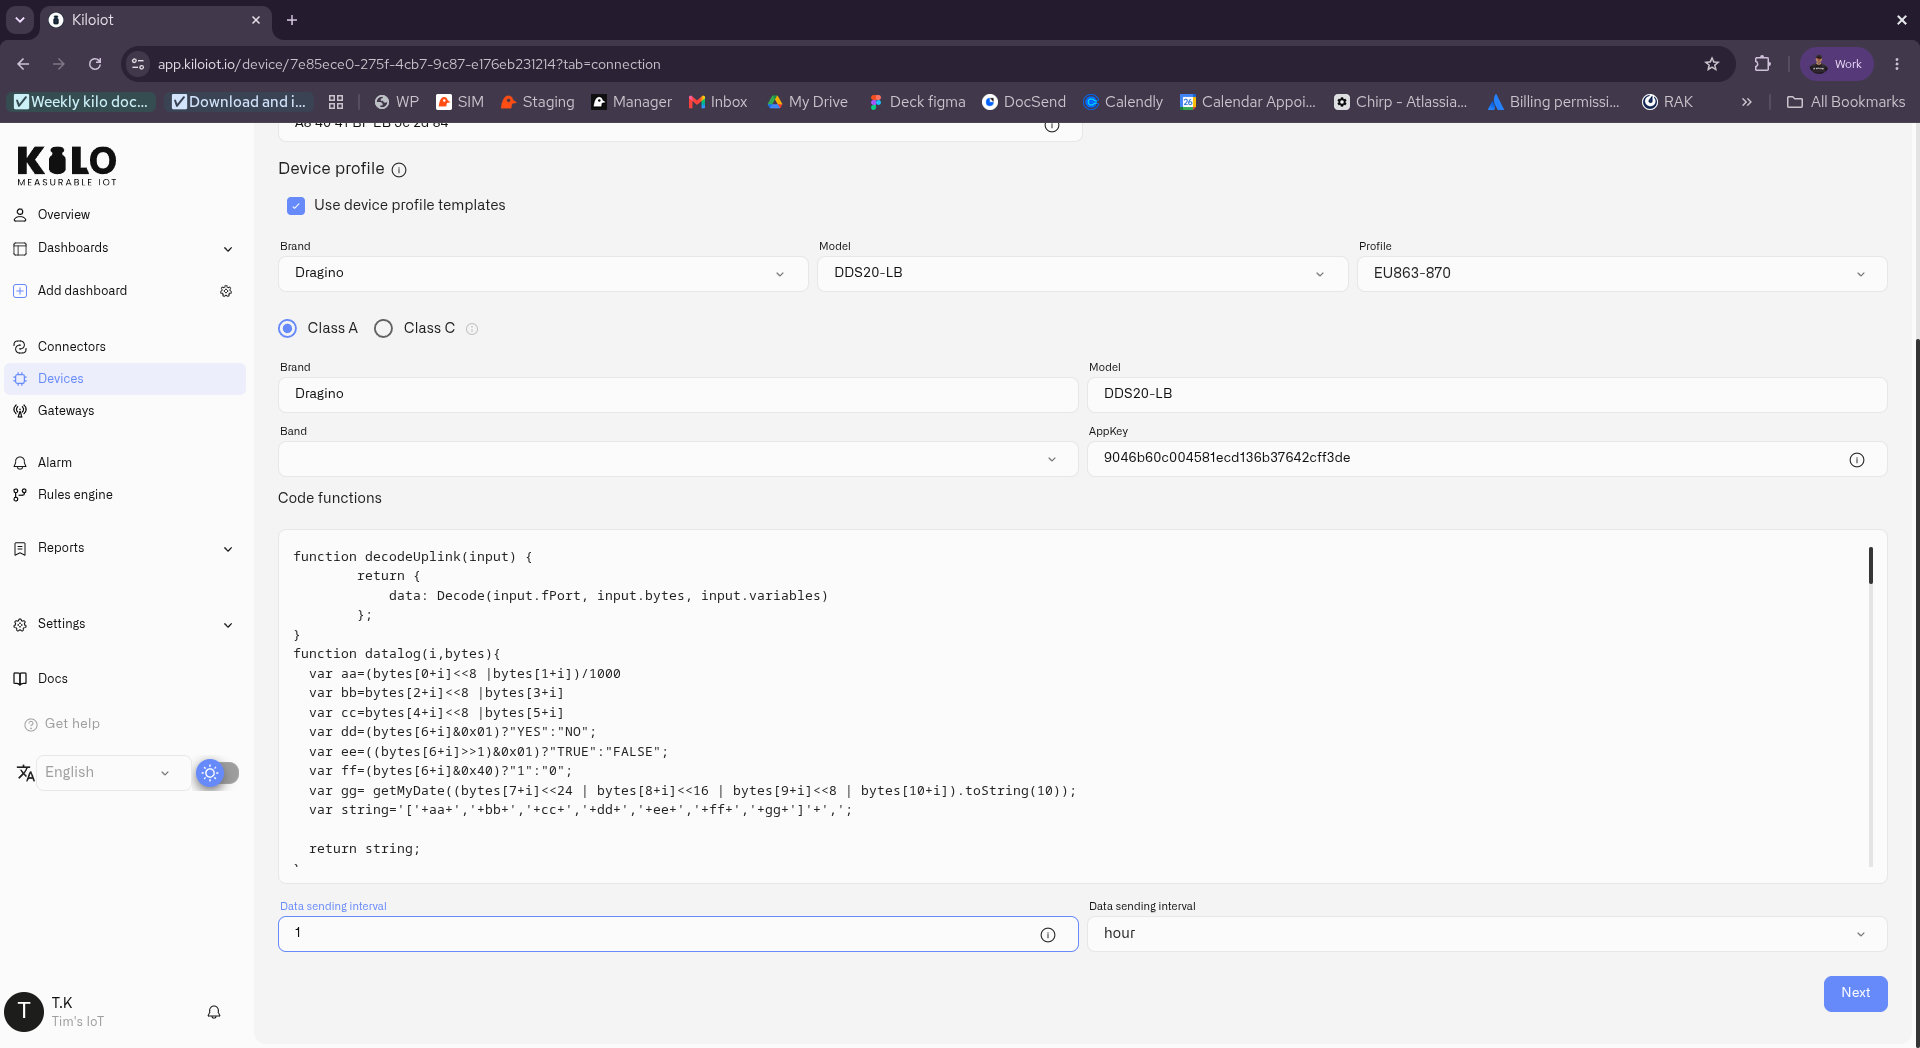 Data sending interval
Step 7 — (Optional) Review your Metric Templates
Under Devices → Metrics Templates you build your own measurement vocabulary — Units, Normalized Keys, and Metrics — the reusable building blocks that turn a raw field into a clean, labeled value (e.g. a Distance metric in centimeters). Kilo doesn't hand you a fixed set of fields to work within; you define exactly the units and metrics your deployment needs and reuse them across every device. Define a metric once, apply it everywhere — it's fully customizable, and it scales. Set these up first or create them on the fly as you map.
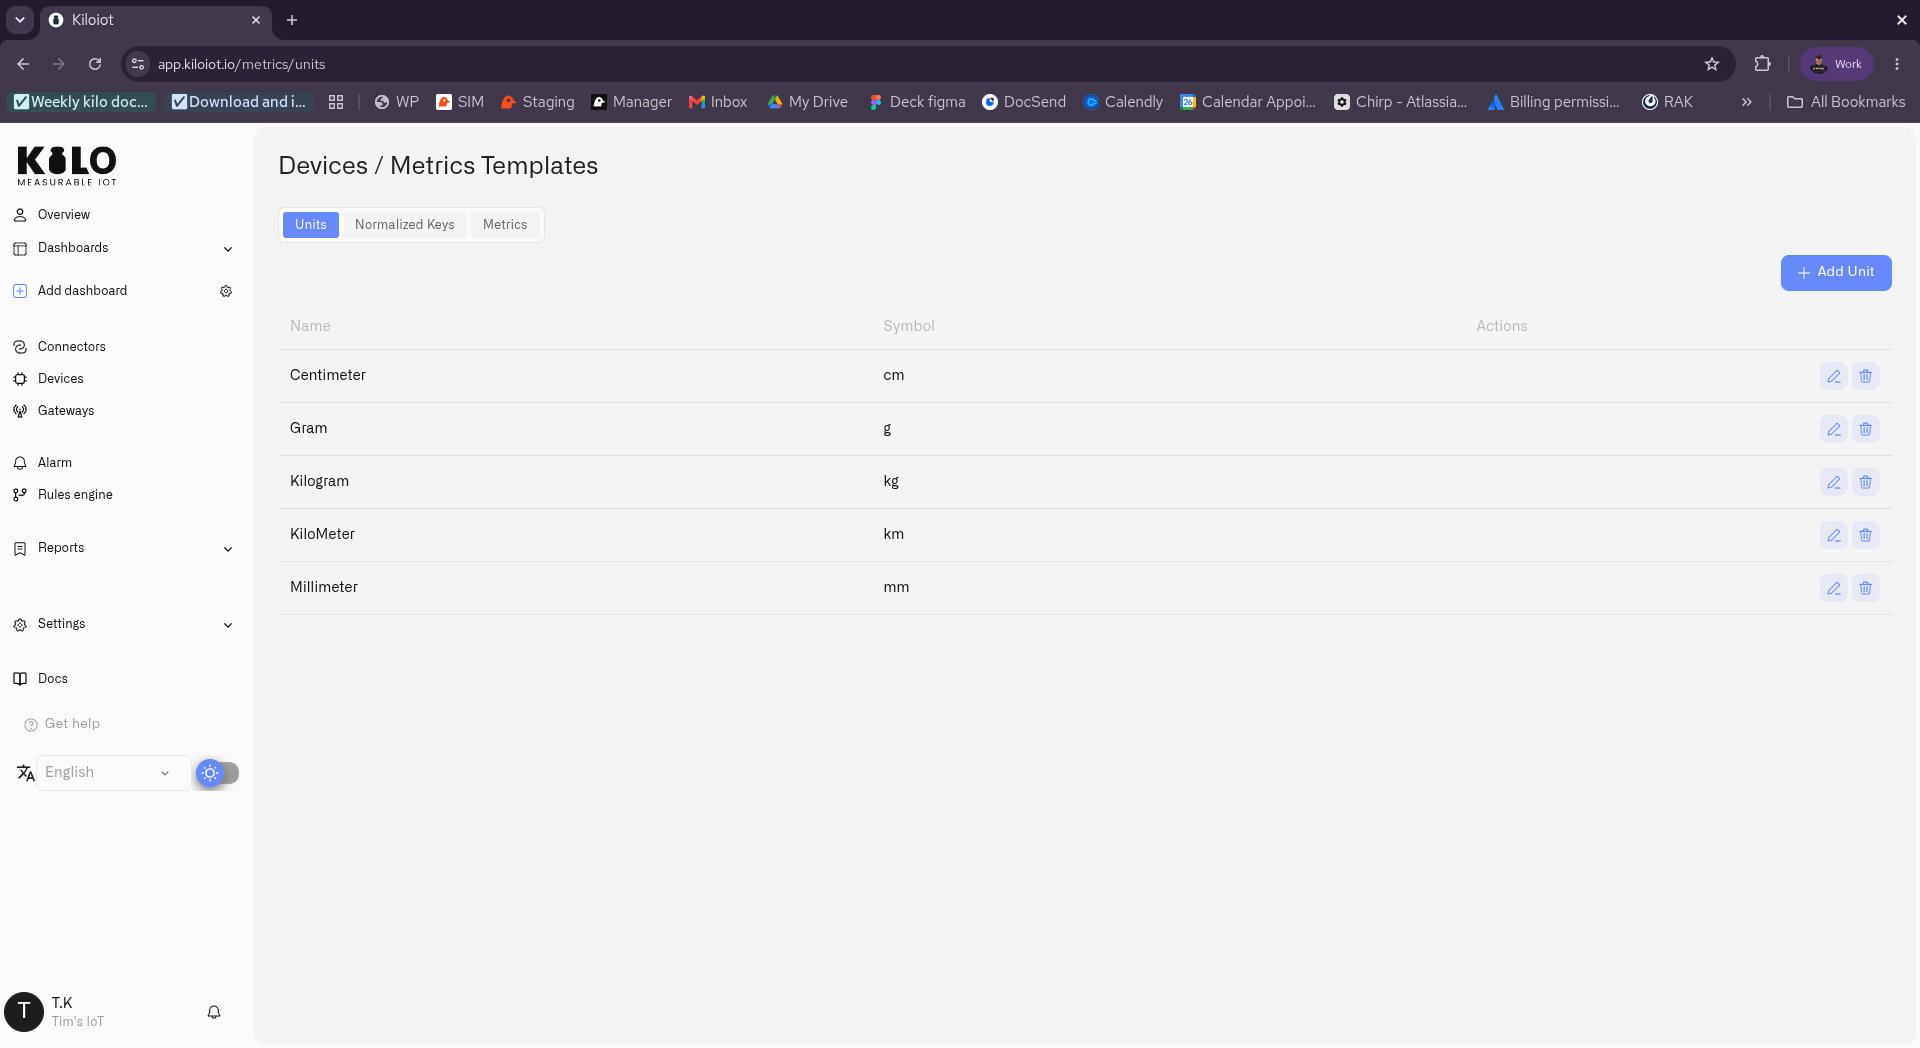 Metric Templates — Units, Normalized Keys, Metrics
Step 8 — Map the raw payload keys
Open the Mapping tab. Once you've entered the Device EUI and AppKey and the device has joined the LNS and sent an uplink, the fields it transmits appear under Device data key — for the DDS20-LB that includes Distance_cm, BatV, Battery_level, Interrupt_flag, Sensor_flag, and radio info. Pick the raw Device data key you want to track.
Don't see any fields under Device data key? The list only populates once the device has actually joined and reported. If it's empty: double-check the Device EUI and AppKey from Step 5, confirm the device is powered and transmitting, and make sure it isn't already joined to another network server — it needs to send a fresh join request to this one. It's also worth refreshing the page — sometimes the data has already arrived and the view simply hasn't updated yet.
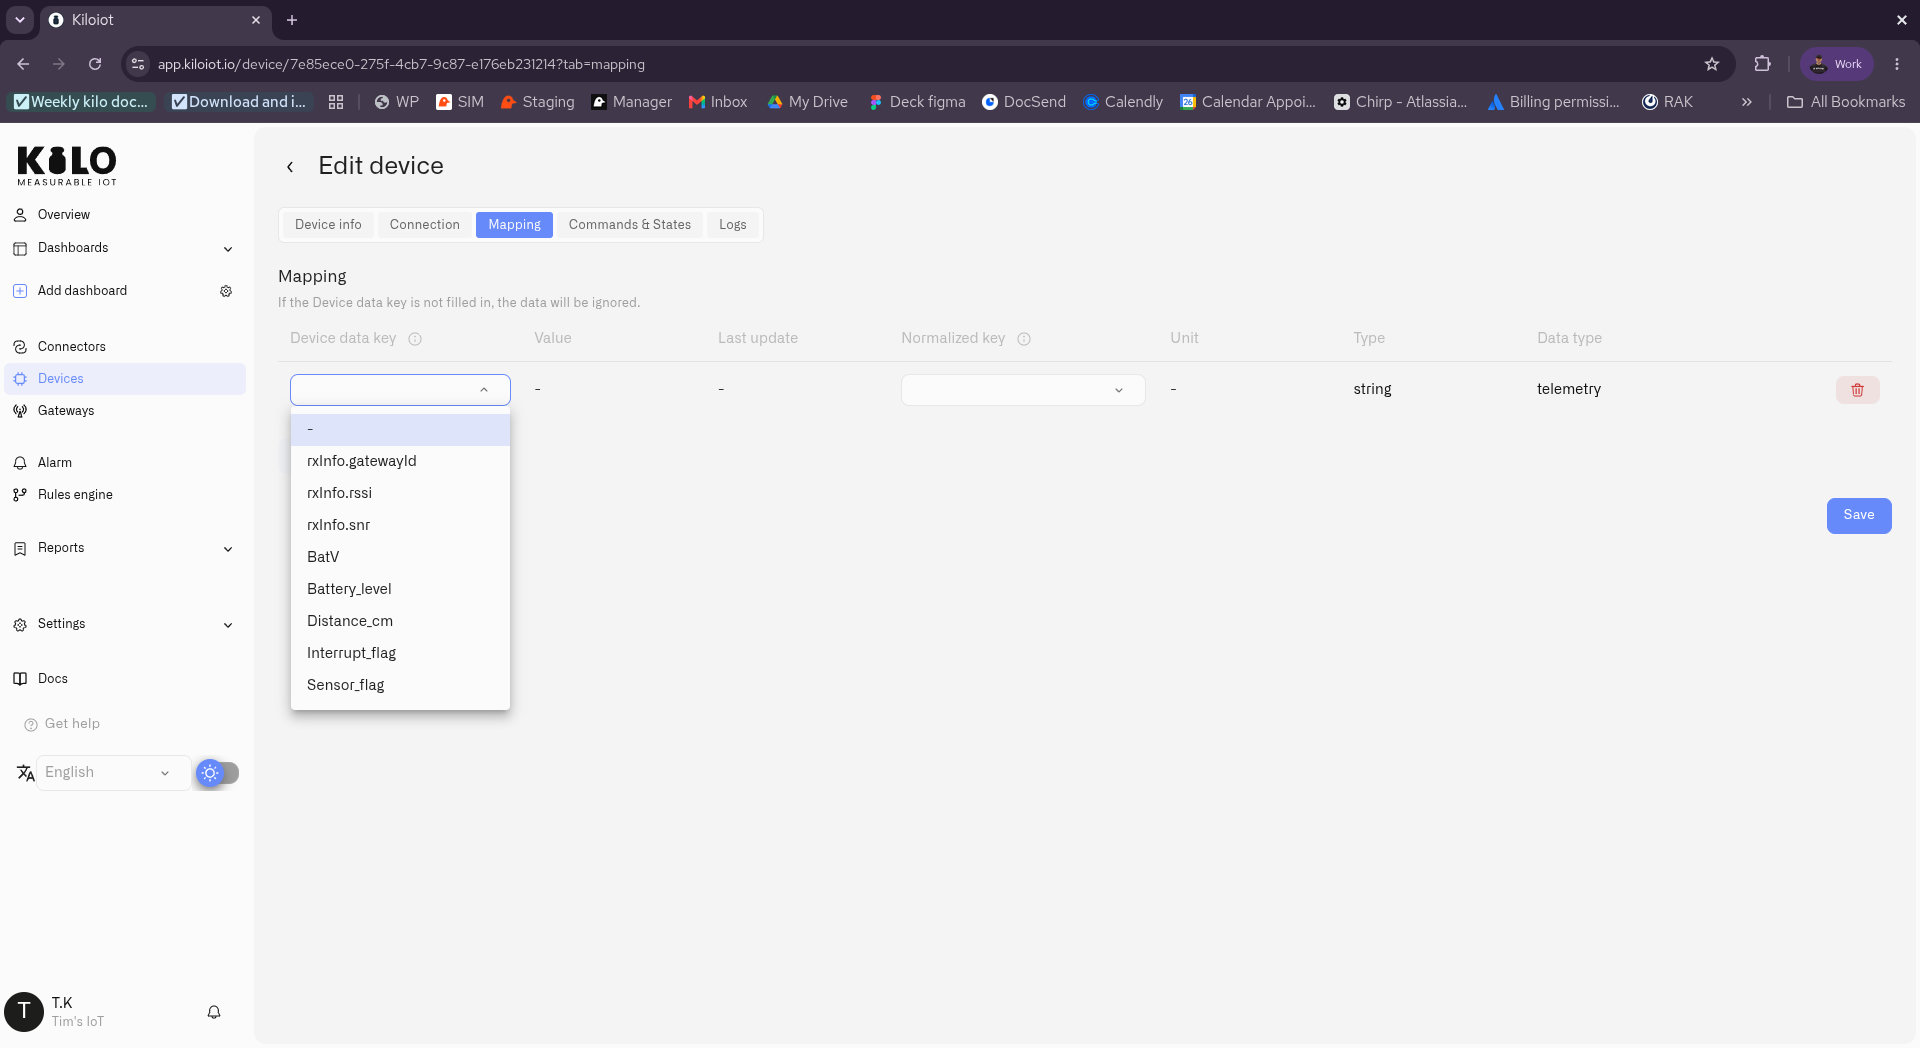 Mapping tab — the device's raw payload keys
Step 9 — Normalize it into a clean metric
For each field, add a metric: give it a Normalized key (for example Distance or Battery Voltage), a Type, and a Data type (Telemetry). From here on, dashboards, rules, and alerts show the friendly name and unit — not the raw field the firmware sends.
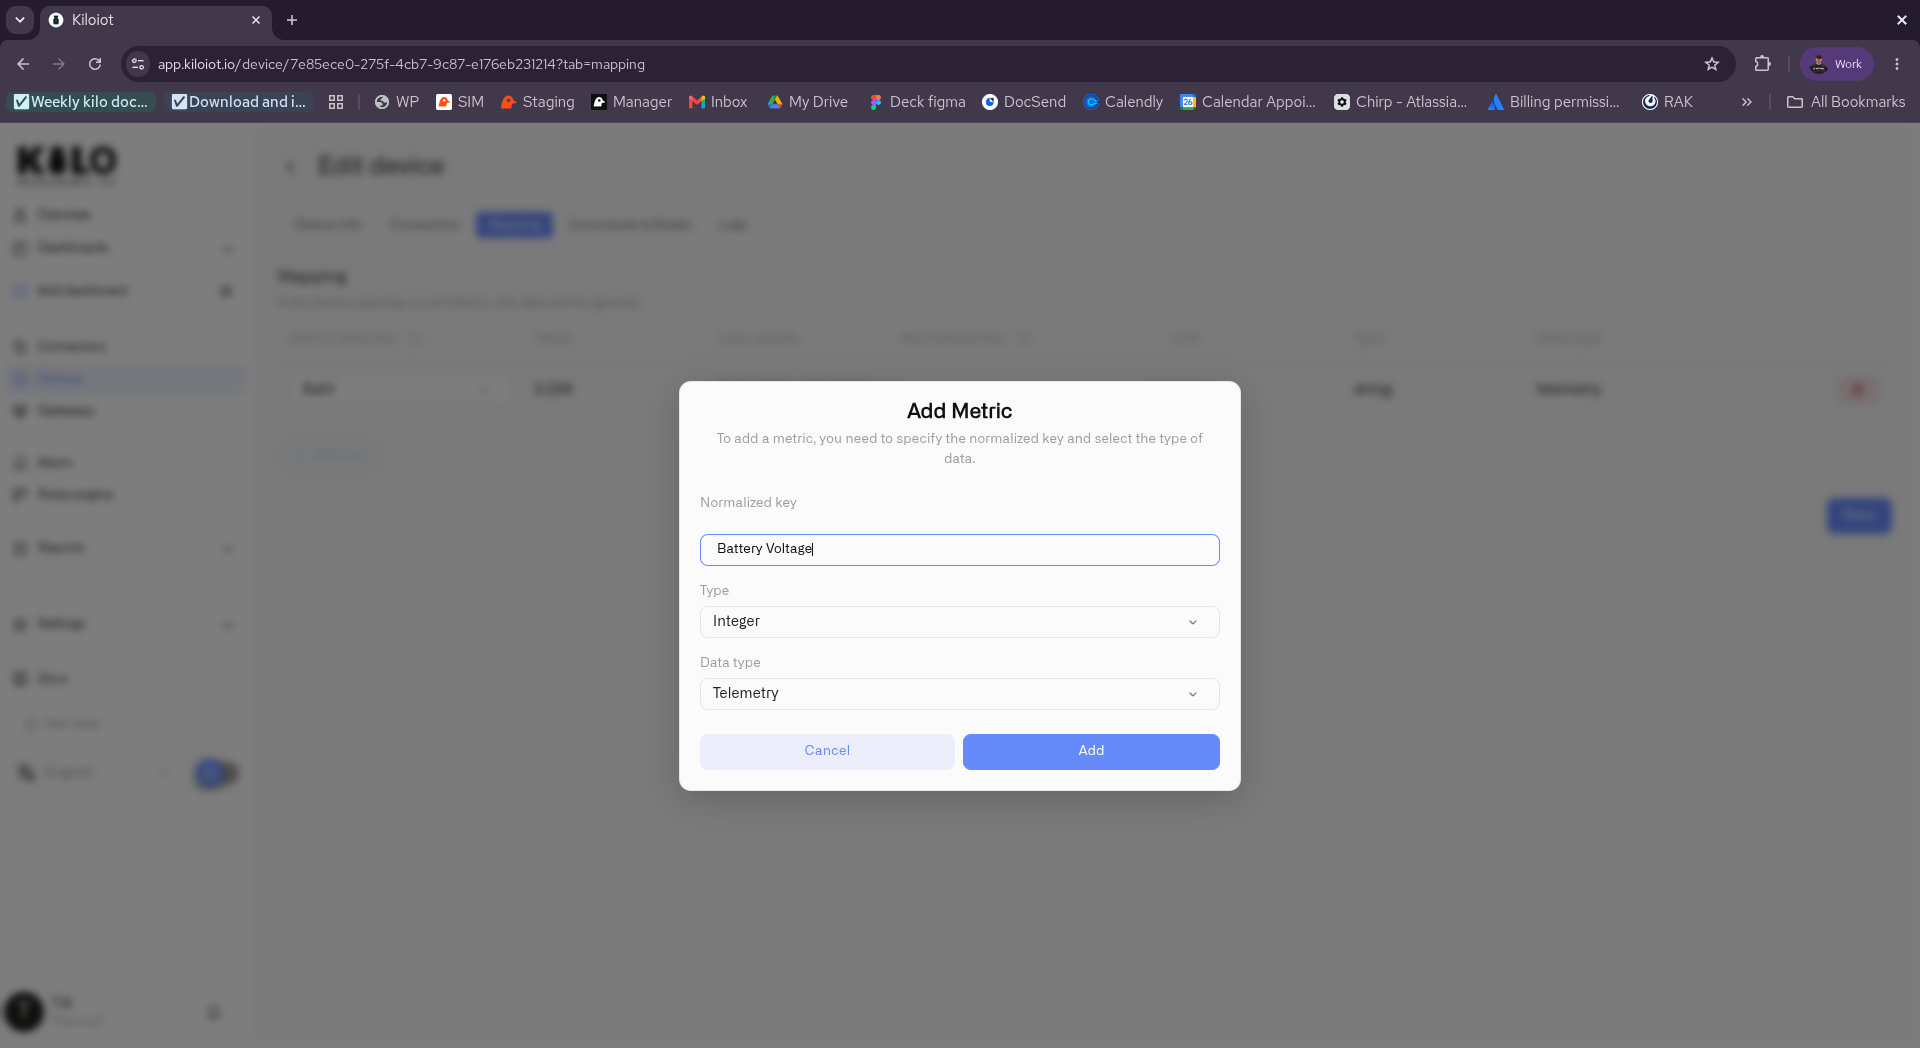 Add Metric — normalized key, type, data type
Step 10 — Confirm data is flowing
Open the Logs tab to see the latest readings the platform has received, with timestamps, type, and value — here, Distance and Battery Voltage arriving from the DDS20-LB.
Note that Logs shows only the fields you mapped in the previous step. If a normalized key isn't mapped, its data won't appear here — map it first, then wait for (or trigger) a new reading.
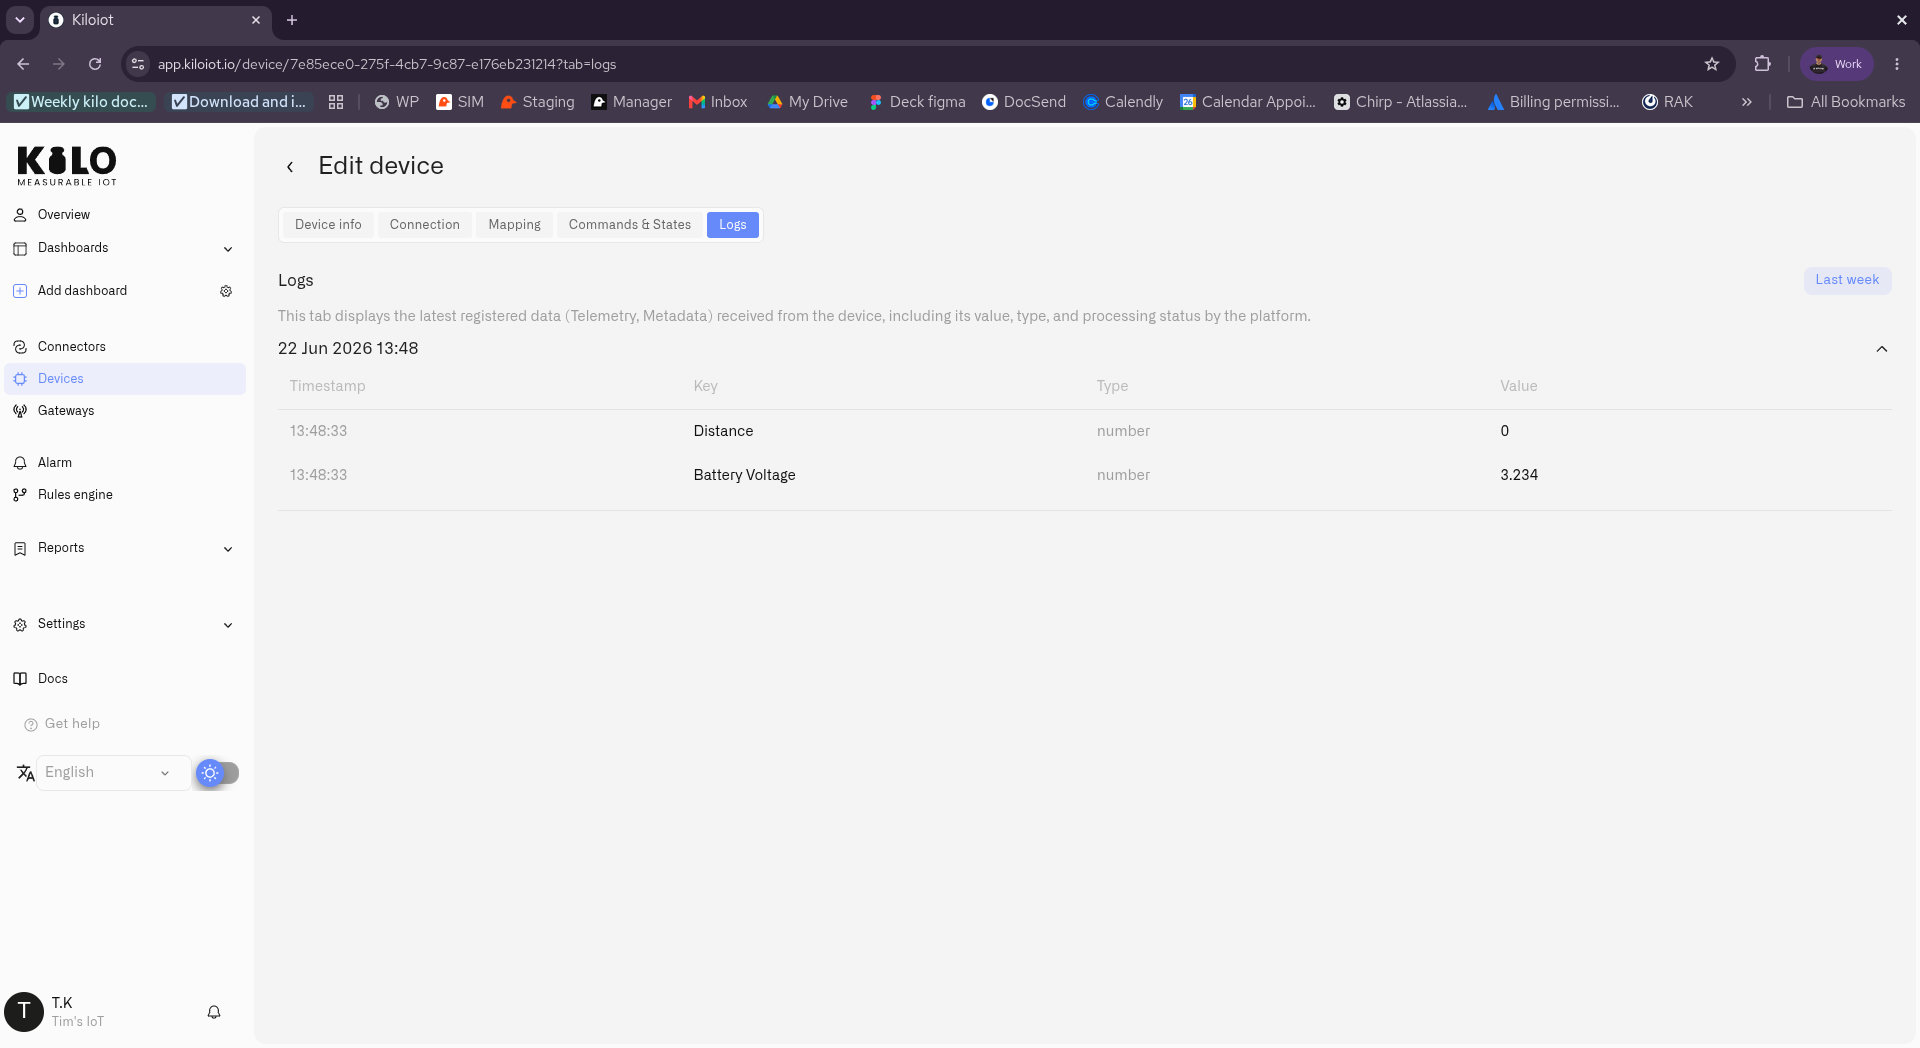 Logs tab showing live Distance and Battery Voltage readings
Step 11 — Add a widget to a dashboard
Open a dashboard, switch to edit mode, and click Add widget.
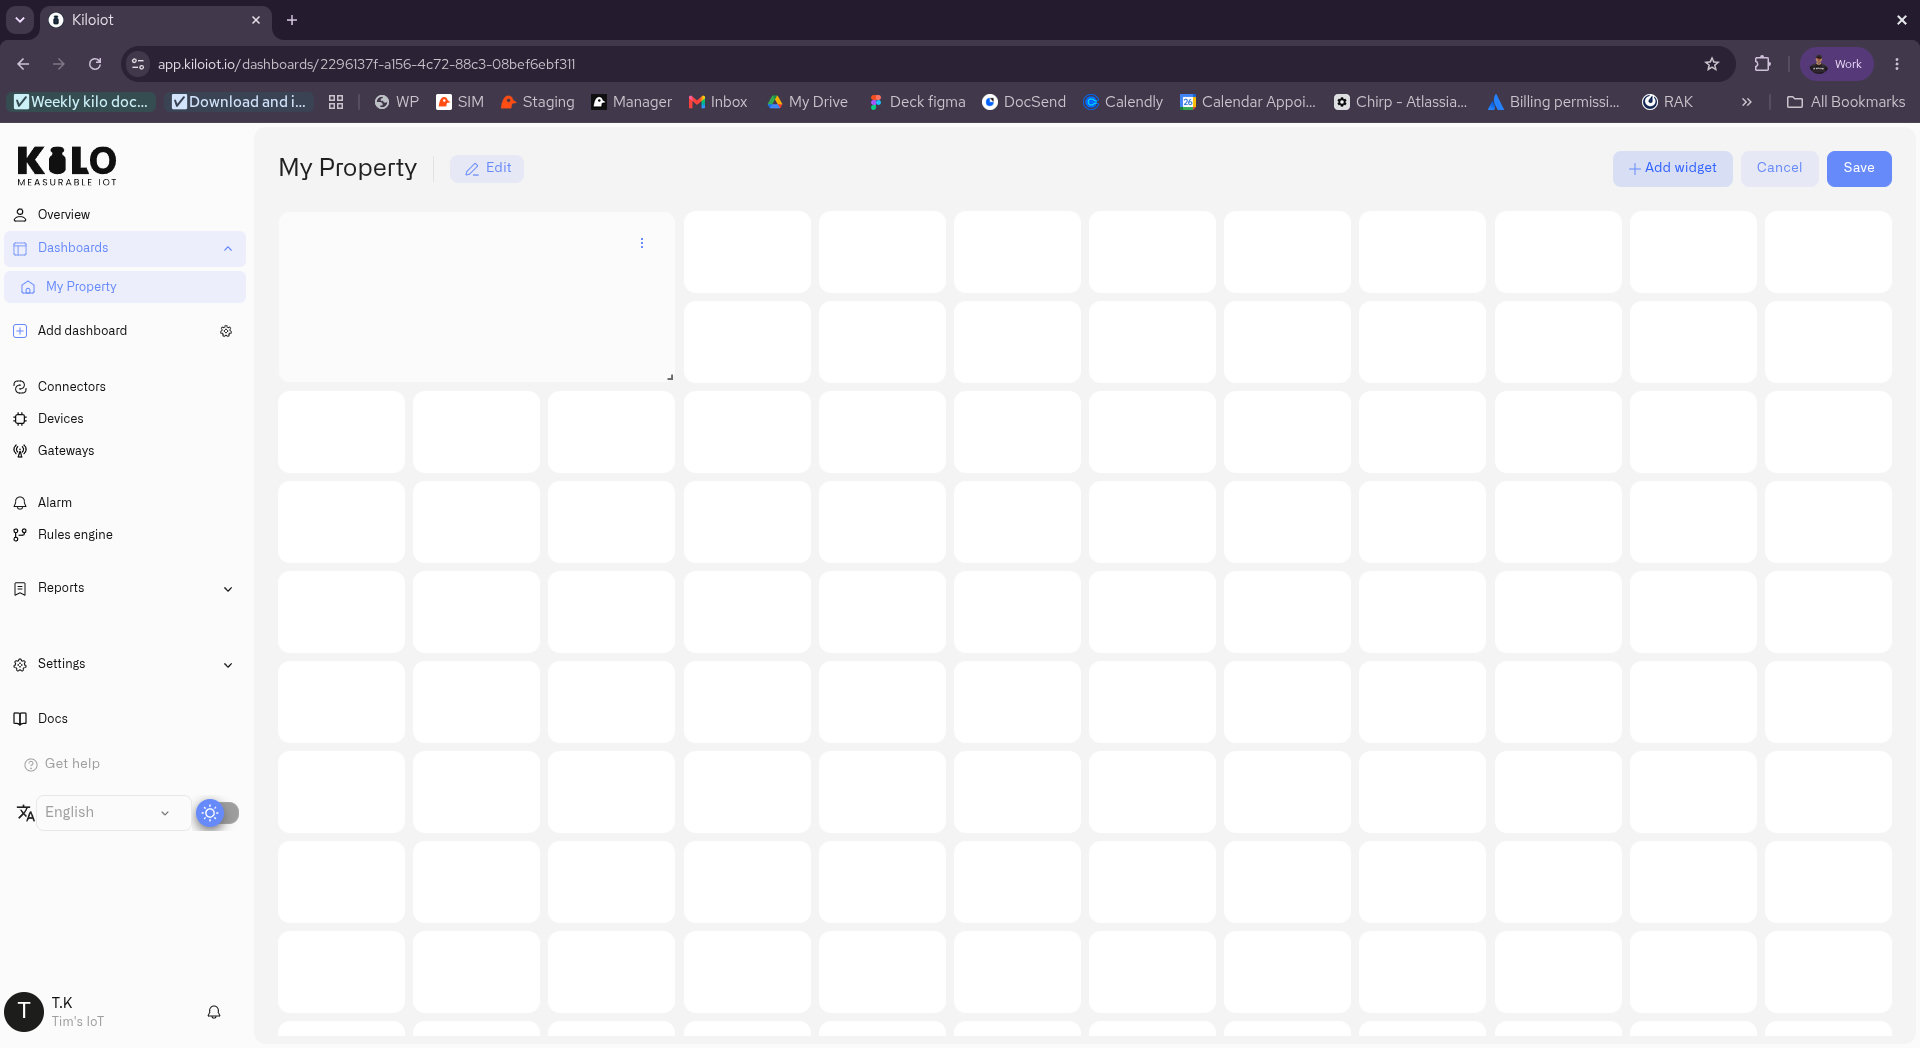 A dashboard in edit mode with Add widget
Step 12 — Choose a widget
You can pick any widget for the job — Chart for trends, Map for location, Image for a floor plan, the Digital building twin for a live 3D model, Control to send commands back to the device, and more. For this example we just want the tank's latest level, so choose Last data — the widget for a device's current readings.
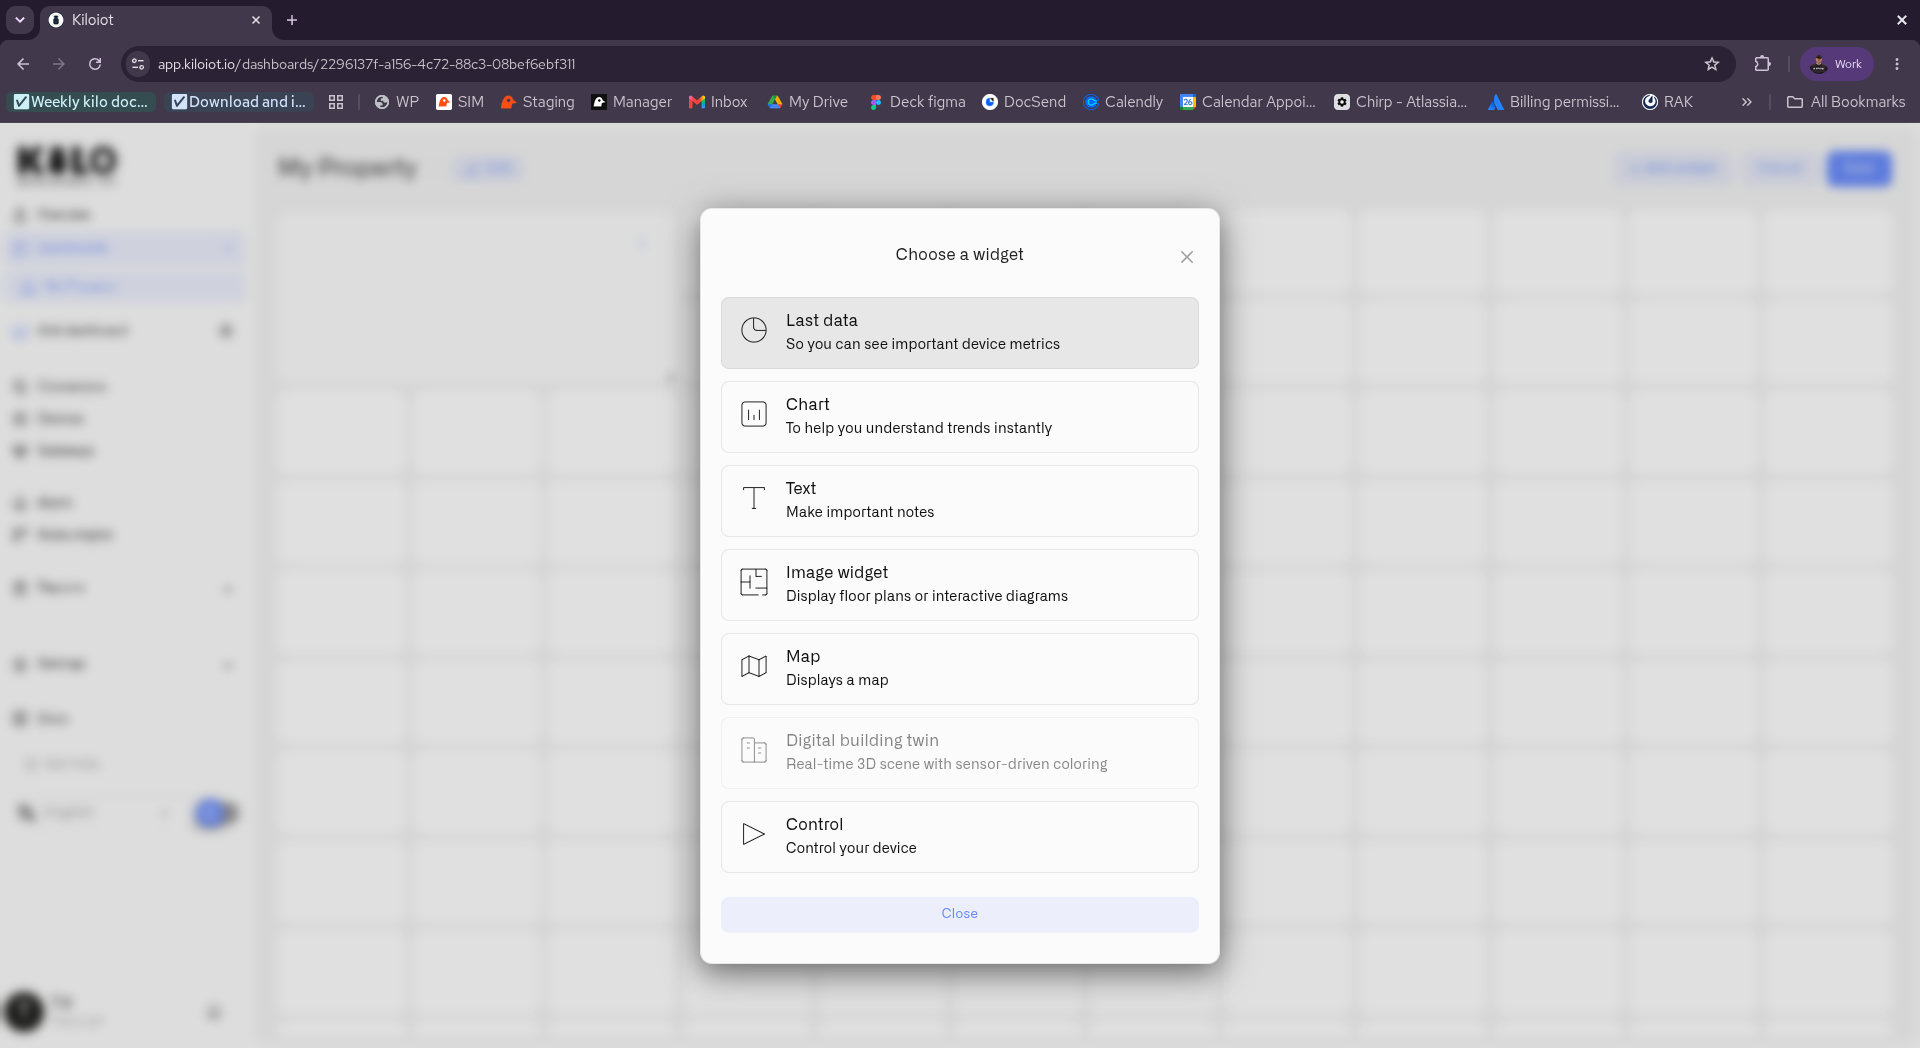 Choose a widget dialog
Step 13 — Point it at the sensor's metric
On the Datasource tab, set Source to Device, choose your Tank Distance Sensor, and select the Device metric — Distance. Right next to the metric you'll see a Conditions button — that's the next step, and the important one.
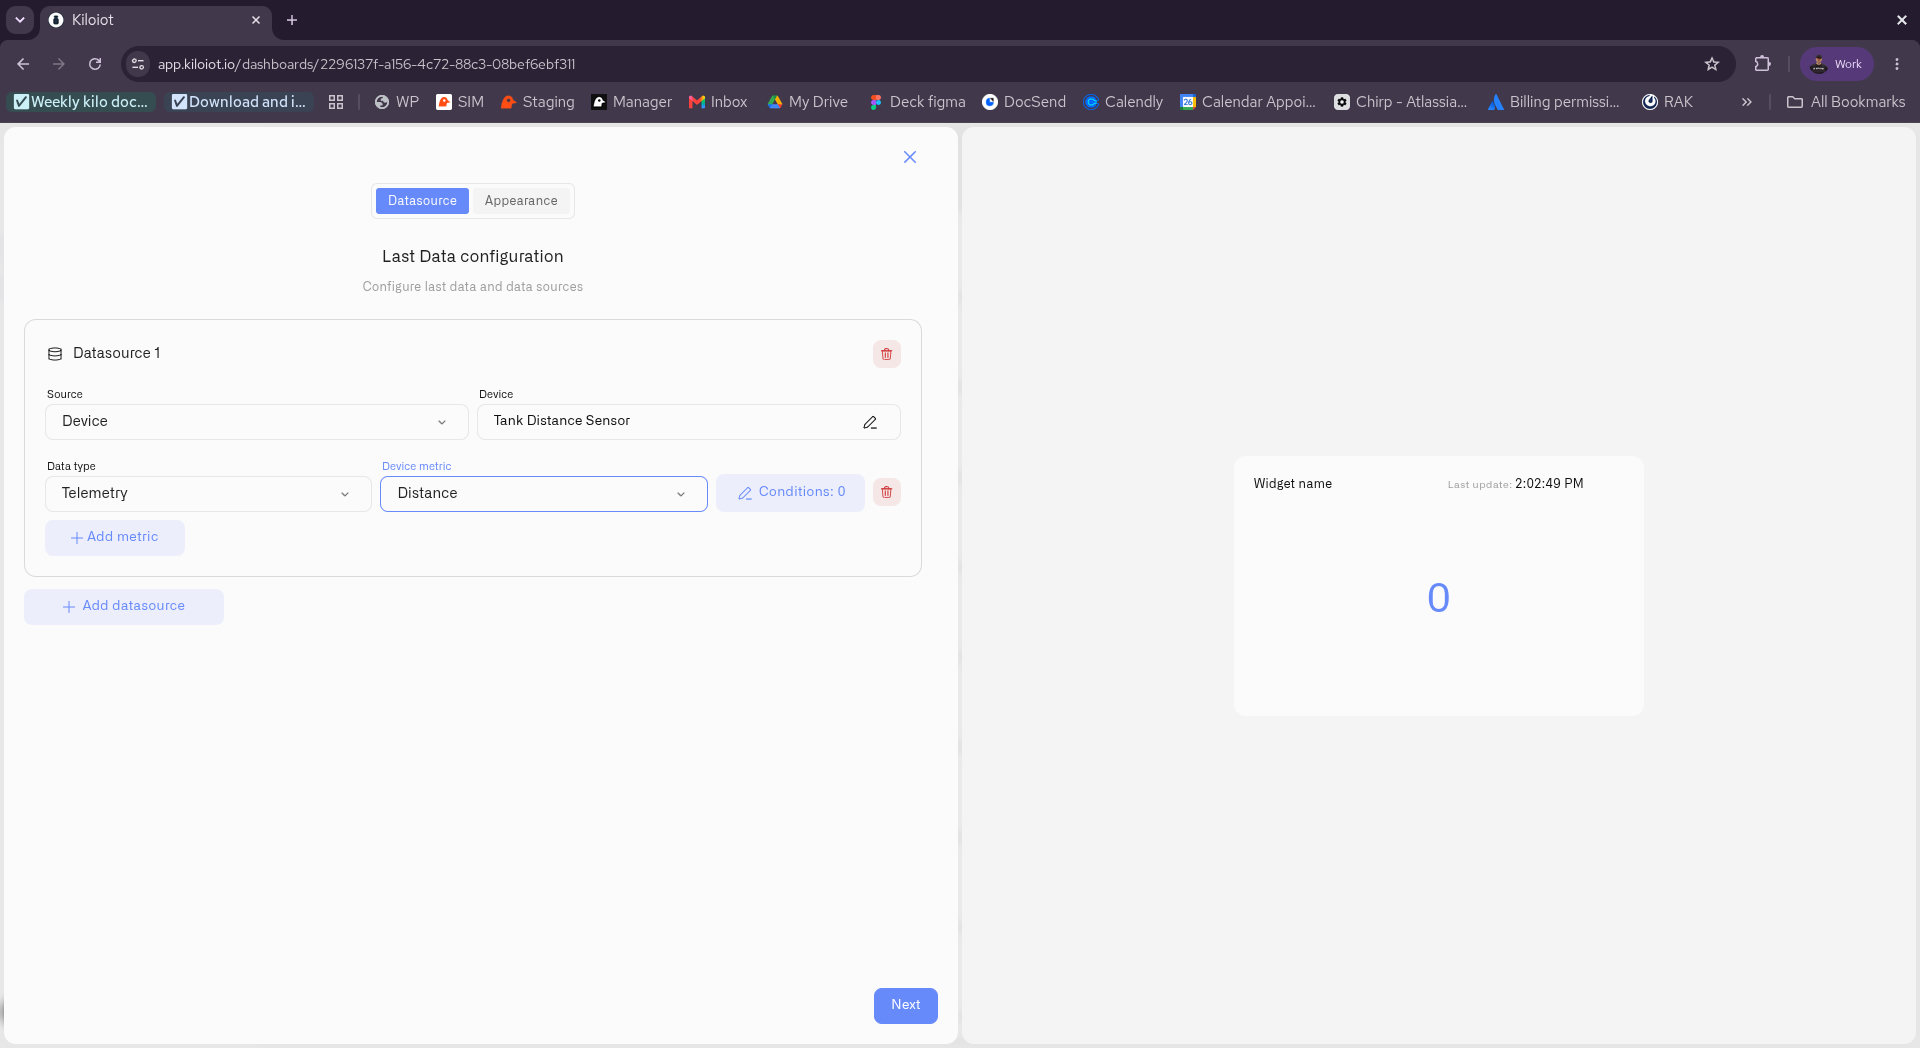 Datasource — device and metric, with the Conditions button
Step 14 — Set the conditions (the most important step)
This is what turns a gauge into something that tells you when to act — and it's the most flexible part of the widget. Open Conditions and define value ranges, each with a name and a color, so the reading is judged exactly the way your use case needs.
You decide what matters. On a fuel or salt tank you'd want to know as the level gets low, so you can refill in time; on a sump pit you'd flag the level rising, because that means the pump isn't keeping up. Same widget — your logic. You also name the conditions yourself — Empty, Refill, Half, Full below are just what we called them; name them whatever fits your process. For this tank we set:
- Empty (0–20) — red
- Refill (20–40) — red
- Half (40–60) — amber
- Full (60–100) — green
You set the value ranges and colors however you like, and conditions are priority-ordered — the first matching rule wins — so you tune exactly what "warning" and "critical" mean for your tank.
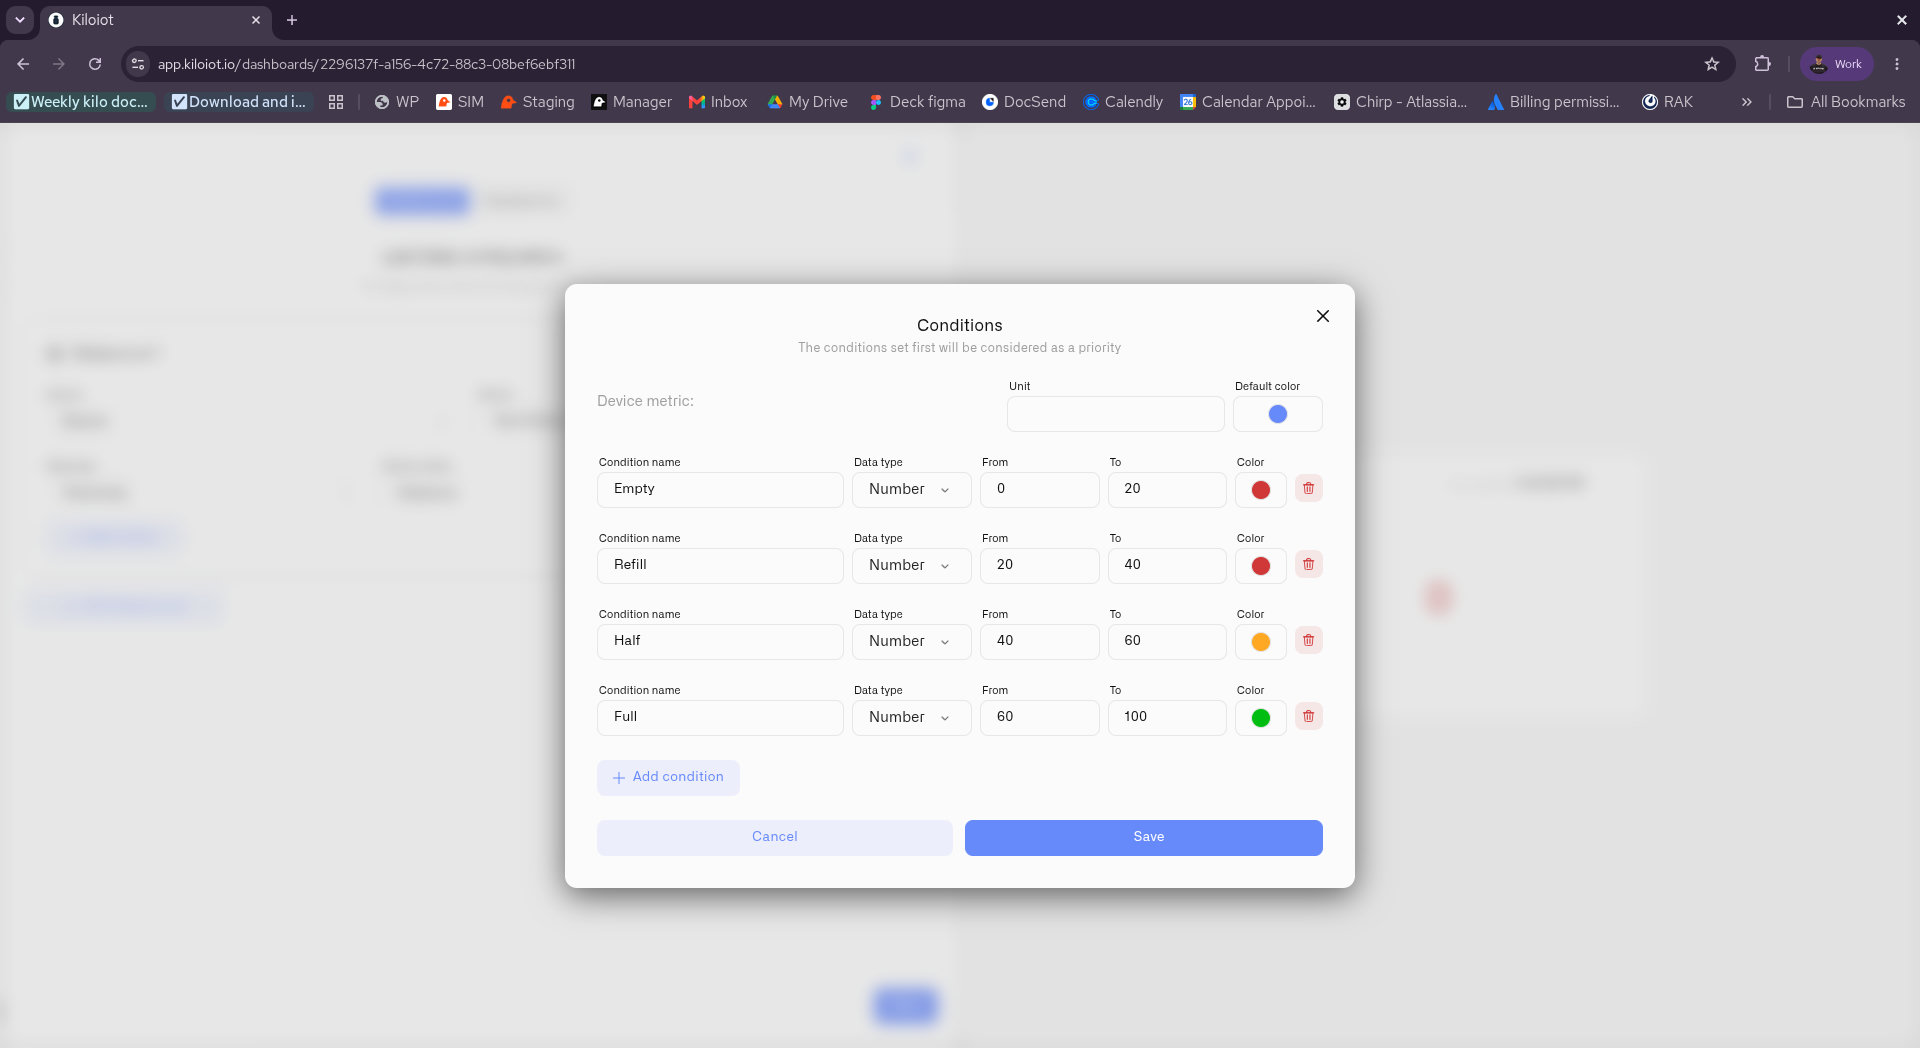 Conditions dialog — value ranges with colors
Step 15 — Make it a Tube gauge
Switch to the Appearance tab and pick how the reading is shown. The Last data widget offers several display types — Number, Doughnut, Pie, Gauge, Radial gauge, and Tube — so you choose whatever suits your use case. For a tank a Tube fits best — a vertical filling gauge that reads like the tank itself — so that's what we use here. Set the value range (Min/Max) — for a tank that's its empty-to-full range, i.e. the tank's height — and the number of tick marks. The ticks pick up the colors from the conditions you set in the previous step, so the gauge fills and recolors live — green when full, amber at half, red when it's time to act. A live preview updates as you go.
In this guide the gauge reads 0 because the sensor isn't mounted yet — once it's installed and reporting, the tube fills to the tank's actual level and the liquid fill recolors with it.
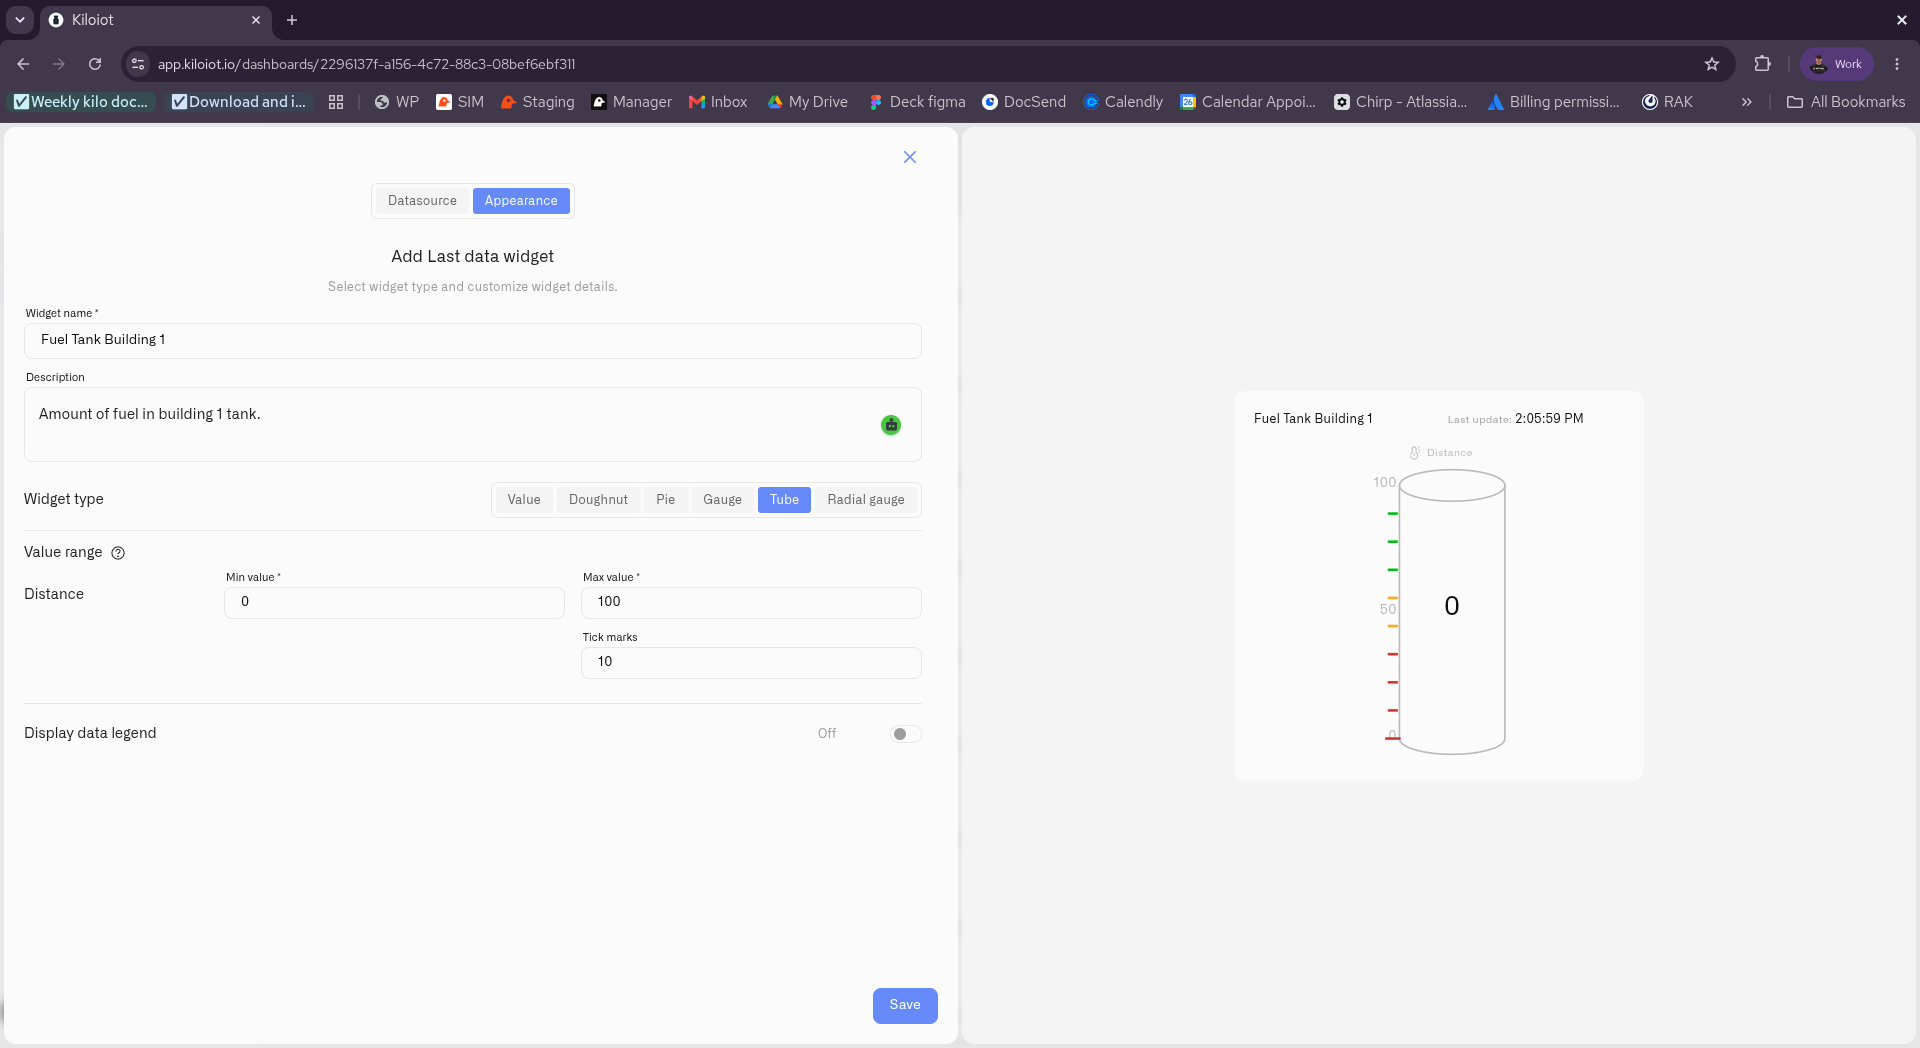 Appearance tab — Tube widget with value range and color-coded tick marks
Done
Your DDS20-LB is now a live, color-coded tank gauge on the dashboard — next to anything else you're monitoring. The same normalized Distance metric can also drive automation rules and alerts (for example, notify someone when the tank crosses the "Refill" line), with no extra wiring.
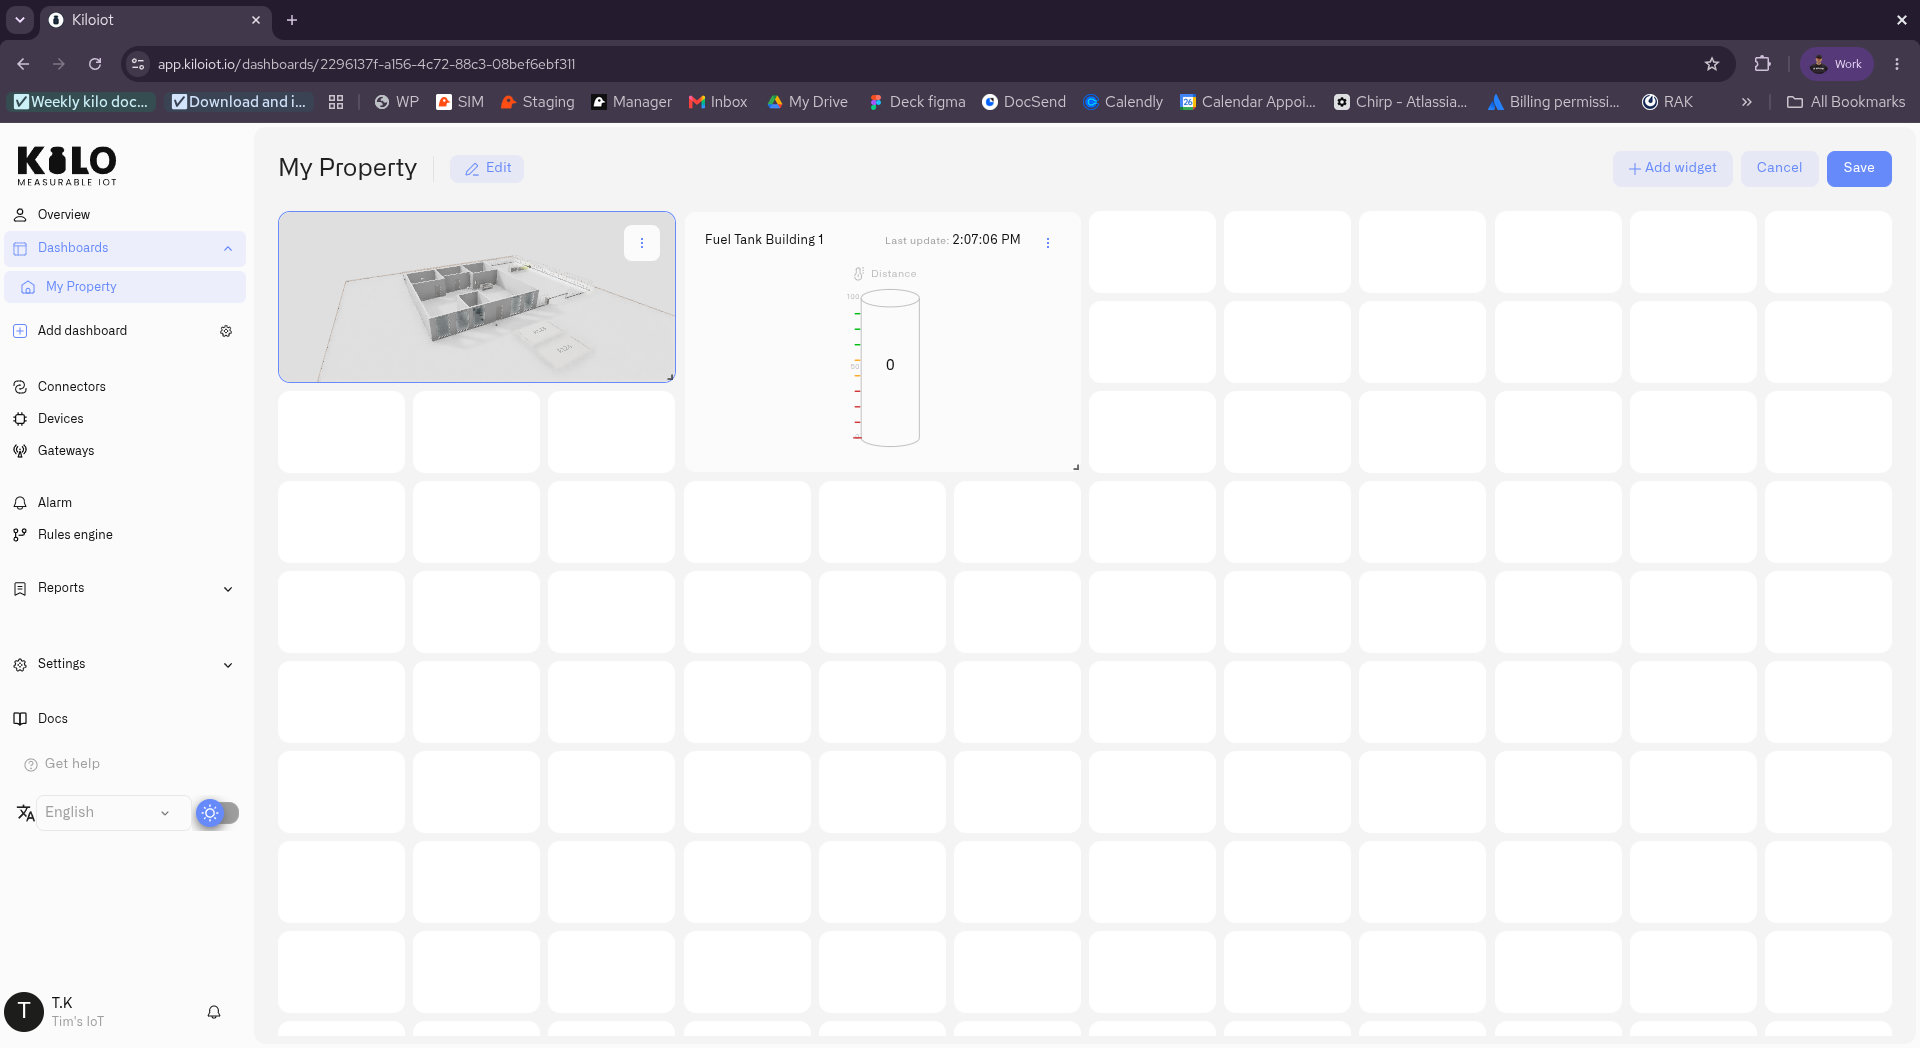 The finished dashboard — the Tube gauge alongside a 3D building twin